偏相関係数を求める式を記します.数学的根拠は省略します.

ここで,変数 y, z の相関係数を ryz とし,第3の変数を x とします.
with Database, Statistics and Nutrition

偏相関係数を求める式を記します.数学的根拠は省略します.
ここで,変数 y, z の相関係数を ryz とし,第3の変数を x とします.
EXCEL のワークシートに挿入されたテーブルにはデフォルトでオートフィルターが設定されています.このテーブルに対してオートフィルターをかけた結果を VBA で取得する方法は難解で,従来の考え方とは少し異なります.
より抽象度の高い考え方をする必要があります.リレーショナルデータベースの概念である集合論を理解する必要があります.
EXCEL は散布図を描く際によく用いています.散布図のデータ系列の指定は奥深く,非常に難しいものがあり,少し凝ったことをしようとすると大変な目に遭います.
手動では設定不可能なほどの数のデータ系列の設定を VBA から行えないか,試行錯誤しました.今回はマクロの記録にとどめます.
総務省の都道府県・市区町村別統計表は 5 年毎に施行される国勢調査を元に作成されており,日本の人口統計の基本となる資料です.
今回はこの資料を元に人口と人口増減率を散布図にするため第一正規形にします.
学会の季節ともなると PowerPoint でのスライド作りが忙しくなってきます.蛋白質の分子構造を表現する方法をいくつか紹介します.
これが重要な分岐点になります.大きな学会になると発表専用の PC 端末が準備されており,カスタマイズは不可能です.これは大きな制約条件になります.
動画を扱う場合,ファイルサイズが非常に大きなものになり,場合によっては YouTube などへのリンクを貼り付けるに留める必要があるかも知れません.その場合,発表用の端末がネットに繋がるかどうかも制約条件の一つとなります.
この場合はあまり効果的な視覚効果は期待できません. GIF アニメーションを見せるくらいがせいぜいです.
Protein Data Bank というデータベースがあります.蛋白質の立体構造を位置情報込みで登録したデータベースで,誰でも無料で利用できます.
フリーウェアの QuteMol というソフトウェアがあります.ダウンロードした pdb ファイルをこのソフトで開き,GIF アニメーションで保存すると,回転するアニメーションで保存できます.
フリーソフトウェアです.プラグインとして Discovery Studio ActiveX Control がインストールされます.これを PowerPoint から流用します.詳細はPowerPointやPDFにいろいろなマルチメディアを埋め込む(3) を参照してください.
やってみると病みつきになります.ただし,巨大な分子になるとコンピュータのパワーがそれなりに必要になります.
手動で描くわけですから ,これはある意味,力技になります.細胞膜に浮かぶ蛋白質の断面や奥にあるドメインなどを楕円形の組み合わせで描いていきます.
錯覚を利用します.断面は平面的に,ドメインは立体的に見えればよいのですから,断面に当たる楕円形のグラデーションを線形に,ドメインは放射状を用います.光源と影の角度に注意します.

DS Visualizer や Chimera が使える方なら VRML ファイルに変換し,一般の CG ソフトウェアに読み込ませることで本格的な立体モデルが作成できます.このあたりの詳細は下記の書籍を参考にしてください.


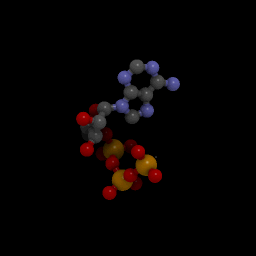
It’s usual to use WP LaTex in order to describe mathematical formula in WordPress. It’s common to use ChemDraw to describe molecular model in local PC, but I couldn’t find WordPress plug-in to describe them.
The query is “WordPress”, “chemical structure”, “plugin”. The result was Chemicalize for first, but it wasn’t found in official WordPress plug-in. Then I found JSmol2wp, and installed.
JSmol2wp express .pdb file. For example, you can find ATP (Wikipedia) and the .pdb file in link of DrugBank. Select all, copy and paste to text editor i.e. TeraPad. Save the file as “ATP.pdb”.
Upload the file in WordPress Dashboard and describe as below.
[jsmol acc='ATP' type='pdb']
See following figure.
[jsmol acc=’ATP’ type=’pdb’]
Google の検索式は “WordPress”, “chemical structure”, “plugin” の AND 検索です.第 1 位には Chemicalize が出てきましたが,WordPress 公式プラグイン検索では出てきませんでした.第 3 位が JSmol2wp というプラグインで,これは公式の検索で出てきます.良さそうでしたのでインストールしました.
JSmol2wp は .pdb ファイルを表示するものです.Wikipedia の ATP のページを例に取ると,DrugBank のリンク先に ATP の .pdb ファイルがあります.これをすべて選択して TeraPad などのテキストエディタに貼り付け,ATP.pdb と拡張子を指定して保存します.メモ帳では改行コードに不備があり正常に動作しません.
WordPress のダッシュボードから ATP.pdb ファイルをアップロードし,下記のコードを記述します.
[jsmol acc='ATP' type='pdb']
下図のように表示されます.筆者の環境では 3 段目右端の “BALL AND STICKS” ボタンを押さないと表示されませんでした.
[jsmol acc=’ATP’ type=’pdb’]
なお,.pdb ファイルは PDB や PDBj などのデータベースから検索するのが本筋ですが,候補があまりにも多く絞りきれませんでした.化学を専攻している人ならばこちらのほうが良いと思います.
追記
JSmol2wpは2025年7月20日現在,PHP最新バージョン8.x.xxと衝突するため無効化しました.
Evidence from individual trials comparing Mediterranean to low-fat diets to modify cardiovascular risk factors remains preliminary.
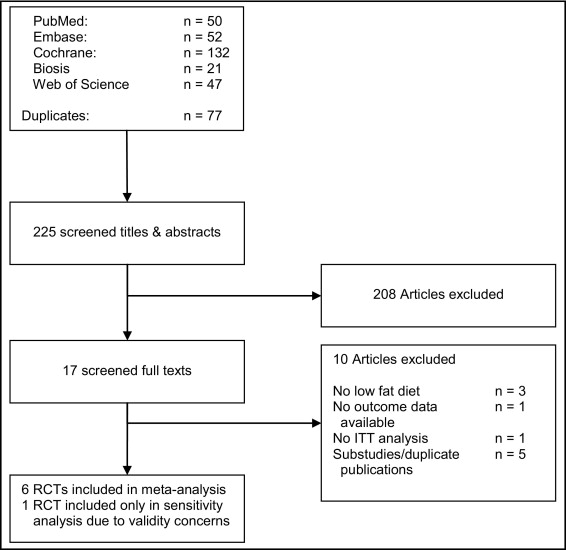
We systematically searched MEDLINE, EMBASE, Biosis, Web of Science, and the Cochrane Central Register of Controlled Trials from their inception until January 2011, as well as contacted experts in the field, to identify randomized controlled trials comparing Mediterranean to low-fat diets in overweight/obese individuals, with a minimum follow-up of 6 months, reporting intention-to-treat data on cardiovascular risk factors. Two authors independently assessed trial eligibility and quality.
We identified 6 trials, including 2650 individuals (50% women) fulfilling our inclusion criteria. Mean age of enrolled patients ranged from 35 to 68 years, mean body mass index from 29 to 35 kg/m2. After 2 years of follow-up, individuals assigned to a Mediterranean diet had more favorable changes in weighted mean differences of body weight (−2.2 kg; 95% confidence interval [CI], −3.9 to −0.6), body mass index (−0.6 kg/m2; 95% CI, −1 to −0.1), systolic blood pressure (−1.7 mm Hg; 95% CI, −3.3 to −0.05), diastolic blood pressure (−1.5 mm Hg; 95% CI, −2.1 to −0.8), fasting plasma glucose (−3.8 mg/dL, 95% CI, −7 to −0.6), total cholesterol (−7.4 mg/dL; 95% CI, −10.3 to −4.4), and high-sensitivity C-reactive protein (−1.0 mg/L; 95% CI, −1.5 to −0.5). The observed heterogeneity across individual trials could, by and large, be eliminated by restricting analyses to trials with balanced co-interventions or trials with restriction of daily calorie intake in both diet groups.
Mediterranean diets appear to be more effective than low-fat diets in inducing clinically relevant long-term changes in cardiovascular risk factors and inflammatory markers.
2012年4月25日の記事では地中海料理が心血管危険因子を減少させるという内容でした.死亡や心筋梗塞・脳卒中などの臨床転帰については評価していませんでした.今回は PREDIMED study というより大規模な試験の結果幾つかの論文が発表され,そのメタ解析を行った論文を紹介します.残念ながら臨床転帰について評価した論文が1つしかなかったため,臨床転帰についてのエビデンスは得られていません.
考察の文中の丸括弧は参考文献の番号です.和訳の瑕疵の責任は私にあります.
地中海料理と低脂肪食を比較した個々の試験からの心血管危険因子に対する修飾のエビデンスは暫定的なままである.
我々は MEDLINE, EMBASE, Biosis, Web of Science, Cochrane Central Register of Controlled Trial を 2011 年1月まで全体的に調査し,その道の専門家に接触し,太り過ぎ又は肥満の人の地中海料理と低脂肪食との無作為化比較試験を同定し,最低6ヶ月間経過観察し,心血管危険因子の治療目的のデータを報告したものについて.2名の著者が別々に試験の有用性と品質を評価した.
我々は6つの試験を同定した.2650 名(50% は女性)が選択基準を満たしていた.参加した患者の平均年齢は 35 歳から 68 歳の範囲で,平均 BMI は 29 から 35 kg/m2 であった.2年間の経過観察の後,地中海料理に割り付けられた個人には加重平均からの差においてより好ましい変化がみられた.つまり,体重 (- 2.2 kg; 95% CI, – 3.9 to – 0.6) , BMI ( 0.6 kg/m2; 95% CI, – 1 to – 0.1), 収縮期血圧 (- 1.7 mmHg; 95% CI, – 3.3 to – 0.05), 拡張期圧 (- 1.5 mmHg; 95% CI, – 2.1 to – 0.8), 空腹時血糖値 (- 3.8 mg/dL; 95% CI, – 7 to – 0.6), 総コレステロール (- 7.4 mg/dL; 95% CI, – 10.3 to – 4.4), 高感度 CRP (- 1.0 mg/L; 95% CI, – 1.5 to – 0.5). 個々の試験の間に観察された不均一性は,概して,共同介入での調整試験や両食事群共に日々のカロリーを制限する試験などの制限分析により排除された.
地中海料理は低脂肪食よりも,臨床に関する心血管危険因子と炎症性マーカーの長期的変化も含めて効果的であるように見える.
不健康な食事と運動不足は米国における心血管疾患の主要な危険因子であり,2000 年においては 40 万人以上が死亡している.心血管危険因子管理の食事による別のアプローチが調査された.低脂肪,高炭水化物食は3年以上に渡る体重減少,2型糖尿病の減少,高血圧管理の改善などが臨床試験において示された.しかしながら,心血管死亡の有益性という観点からのエビデンスが欠落している.
伝統的な地中海料理は,地中海料理は持続的な体重減少に結びつくというエビデンスが欠落しているにもかかわらず,健康的な食事のモデルとしてますます推進されつつある.それには以下の特徴がある.一価不飽和脂肪酸,植物性蛋白質,全粒穀物,そして魚類の大量摂取.またアルコール類を中等度摂取し,赤身の肉類や脱穀した穀物,菓子類の消費が少ないことである.いくつかのコホート研究では地中海料理は心血管疾患や癌,他の全ての死亡率同様,冠動脈疾患や脳卒中の発生率減少に関連している.
今回のメタ解析の目的は,最低6ヶ月間の経過観察期間があり,心血管危険因子において地中海料理と低脂肪食を比較した無作為比較試験のエビデンスをまとめることである.我々は解析を太り過ぎか肥満で,最低でも一つ以上の心血管危険因子を持つ人に限定した.というのも,正常体重の人における2種の食事の効果を比較した試験が皆無であったからである.
我々は MEDLINE, EMBASE, Biosis, Web of Science, 対照試験の Cochrane 中央レジスタのデータベースを ”diets, fat restricted” および “Mediterranean diets” のキーワードで検索した.我々は論文を公開型臨床試験として索引付けされたものか,無作為化に根ざすものを題名か要約に含むものに限定して検索した.また同定された参考文献リスト,進行中または計画中の臨床試験登録簿,最近出版された論説やトピックのレビューを検索し,更に適格な試験がないかその道の専門家にコンタクトを取った.言語に制限は設けなかった.
2名の著者が別々に試験の適格性と品質を評価した.適格な試験は地中海料理と低脂肪食を比較している必要があり,対象は太り過ぎか肥満で少なくとも一つ以上の心血管危険因子を有するか(一次予防),既に冠動脈疾患が確定している(二次予防)必要があった.また無作為比較したデザインで最低でも6ヶ月以上の経過観察期間を必要とすること,治療目的のデータ,つまり体重,血圧,脂質の変化を報告していることが求められた.我々は地中海料理を次のように定義した.中等量の脂肪摂取(主な脂肪源はオリーブオイルとナッツ類),豊富な野菜,赤身の肉が少ない(牛肉と羊肉を鶏肉と魚に置き換えたもの).低脂肪食は以下のように定義した.エネルギー摂取総量のうち脂肪の占める割合が 30 % 以下を目的としたもの.我々は治療の割付の隠蔽に従って試験の品質を評価した.つまり患者や介護者,臨床評価者にも盲検化していること.また完全に臨床経過を観察した患者の割合,患者利益のために早期に打ち切っていないもの.
2名の著者が別々に,出版された試験からのデータと独自の調査者からの付加的データを抽出した.我々は以下をベースラインの心血管危険因子とみなし,2年間の経過観察後の臨床転帰を目的とした.つまり体重,BMI, ウエスト周囲径,収縮期圧および拡張期圧,HDL コレステロール値,LDL コレステロール値,高感度 CRP 値,空腹時血糖値と食感のインスリン値の平均差である.加えて可能な場合にはどのような臨床転帰も抽出した.
我々は治療効果を蓄積し,無作為効果モデルを用いて,無作為化した地中海料理群と低脂肪群の間のすべての危険因子の加重平均の差を計算した.一つの試験からは危険因子の平均値の偏差である標準偏差が見られなかったため,最初に,平均値からの偏差を与えられたP値に対応するt-分布のパーセントポイントで除して求まる標準誤差を計算した.次に標準誤差に標本数の平方根を乗じて標準偏差を計算で求めた.
我々は漏斗散布図 (funnel plot) を用いて出版バイアスの存在を調査した.我々はコクランQテストを用いて不均一性を検定し,目的の全心血管危険因子に渡る治療効果の矛盾度 (I2; 研究全体の全分散で,確率よりも不均一性による) を計測した.我々は含まれる試験の品質の要素に従って治療効果を調べるために感度分析を行った.一次予防試験と二次予防試験,共同介入について調整済みの試験と調整していない試験,日々のカロリー摂取量を制限した試験と制限しない試験.データ解析には Stata 10.1 (Stata Corp LP, College Station, Tex) を用いた.
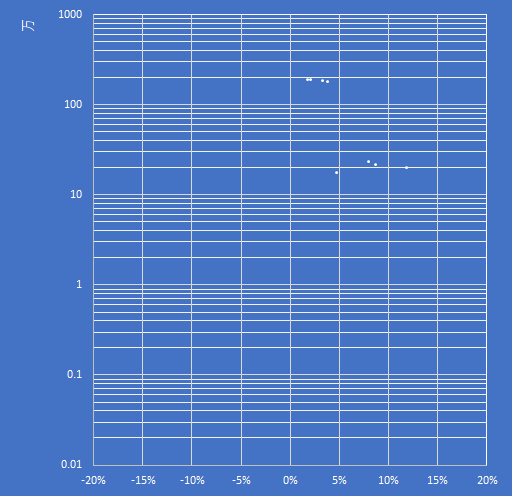
3650 名の患者を含む7つの試験が適合基準を満たした (Figure 1).同定された試験の1つに Indo-Mediterranean Diet heart Study がある.この試験は 1000 名もの患者を有しながらその妥当性が厳しく疑問視されているため,我々は最初この結果を一次解析の結果に含めなかった.しかしながら,この論文が撤回されることはなかったため,感度分析にこの試験結果を加えて結果が変化するか評価した.我々は Lyon Heart Study については解析に含まなかった.というのは,心血管危険因子がプロトコールにおいて評価されているのみで,治療目的が根本になかったからである.
相対的に少数の含まれた試験では,全ての転帰の精度に対して標準化した効果の散布図はそのようなバイアスを示さなかった (P > 0.1) が,出版バイアスの敏感な探索を除外した.
含まれた試験の特性と方法論的品質は Table 1 にまとめた.試験の経過観察期間として2年間のものが4つ,4年間のものが1つあった.PREDIMED trial は未だに進行中であり,平均観察期間は6年間を予定している.我々はこの試験の2年間の観察後のデータをメタ解析に採用した.ただし採血結果は除外した.1年間の観察後のものであり,他の試験では2年後の採血を蓄えていたからである(詳細は付録1を参照のこと).
個人の含まれるベースライン特性は Table 2 にまとめた.参加した患者の平均年齢は 35 歳から 68 歳までの範囲であった.平均 BMI は 29 から 35 kg/m2 の範囲であった.唯一の二次予防試験があり,心血管疾病の確定した個人を含むさらに唯一の試験でもあった(含まれる個人の 40% にあたる).1つを例外として全ての試験は,自由気ままな生活をしている個人に対して,食生活を変更するのに積極的に同意することを介入するよう求めていた.Daily-Dose Consensus Interferon and Ribavirin: Efficacy of Combined Therapy (DIRECT) trial においては,イスラエルの研究所の職場のカフェテリアでのセルフサービスにおける昼食に対して食材を提供した.2つの試験で両群にカロリー摂取を制限し,1つの試験では地中海料理に無作為割付された被験者にのみカロリー制限を課した.他のすべての試験では2群のうちいずれにもカロリー制限は課されなかった.
地中海食に割り付けられた被験者の持続率は 85 % から 95 % の間であったが,低脂肪食に割り付けられた群では 78 % から 93 % であった.ベースラインと2年間観察後の間に食事摂取量の平均変化と,ベースラインの食事摂取量とは Table 3 にまとめた.心血管危険因子のベースライン値と2年間観察後の変化とを付録2に示した.
2つの試験では,低脂肪食群ではそうではなかったのだが,地中海料理に無作為に割り付けられた参加者だけが特定の個別プログラムを提供された.これらの試験の1つでは低脂肪食群 (71 分から 102 分) よりも地中海料理群 (64 分から 175 分) において身体運動量が増加した (P = 0.009).PREDIMED study においては地中海料理に無作為に割り付けられた参加者だけが個別に意欲を高めるグループ教育セッションを四半期ごとに受け,1日 30 g のミックスナッツ類か,1週間に 1 L のオリーブオイルを無料で提供された.3つの試験において,地中海料理群か低脂肪食群に割り付けられたかで試験デザインには全く違いはなかった.
地中海料理群に無作為割付された被験者では,低脂肪食群の被験者よりも体重,BMI,ウエスト周囲径がより減少した.2年後,地中海料理群と低脂肪食群の間の体重の加重平均偏差 (WMD は – 2.2 kg (95% CI, – 3.9 to – 0.6, P < 0.001, I2 = 97%) であり,BMI の加重平均差は – 0.6 kg/m2 (95% CI, - 1 to – 0.1, P < 0.001, I2 = 94%) であり,ウエスト周囲径の 加重平均差 は – 0.9 cm (95% CI, -2 to – 0.2, P < 0.001, I2 = 92 %) であった (Figure 2).
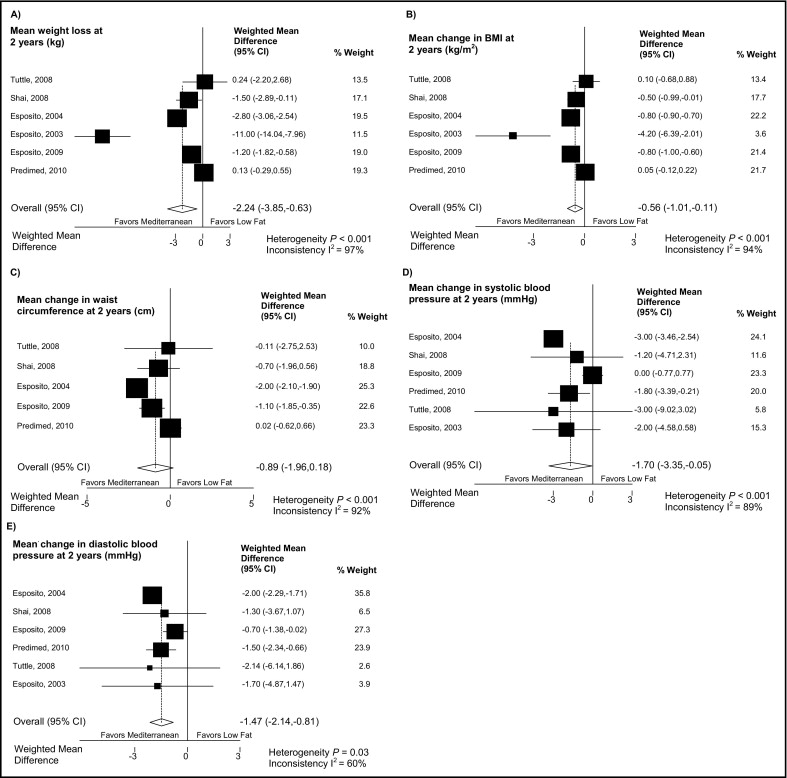
低脂肪食に無作為割付された被験者よりも地中海料理に無作為割付された被験者のほうが収縮期圧,拡張期圧ともにより順調に低下した (Figure 2).収縮期圧の加重平均差は – 1.7 mmHg (95% CI, – 3.4 to – 0.1, P < 0.001, I2 = 89%) であり,拡張期圧のそれは – 1.5 mmHg (95% CI, - 2.1 to – 0.8, P = 0.03, I2 = 60%) であった (Figure 2).
低脂肪食に無作為割付された被験者よりも地中海料理に無作為割付された被験者のほうが,総コレステロール値および中性脂肪値はより順調に変化した.総コレステロール値の加重平均差は – 7.4 mg/dL (95% CI, – 10.3 to – 4.4, P = 0.002, I2 = 73%) であった (Figure 3).LDL コレステロール値(加重平均差 – 3.3 mg/dL; 95% CI, – 7.3 to -0.6; P = 0.3, I2 = 23%) や HDL コレステロール値 (加重平均差0.9 mg/dL; 95% CI, – 1.9 to – 3.8, P < 0.001, I2 = 99%) においては統計的有意差は全く認めなかった.
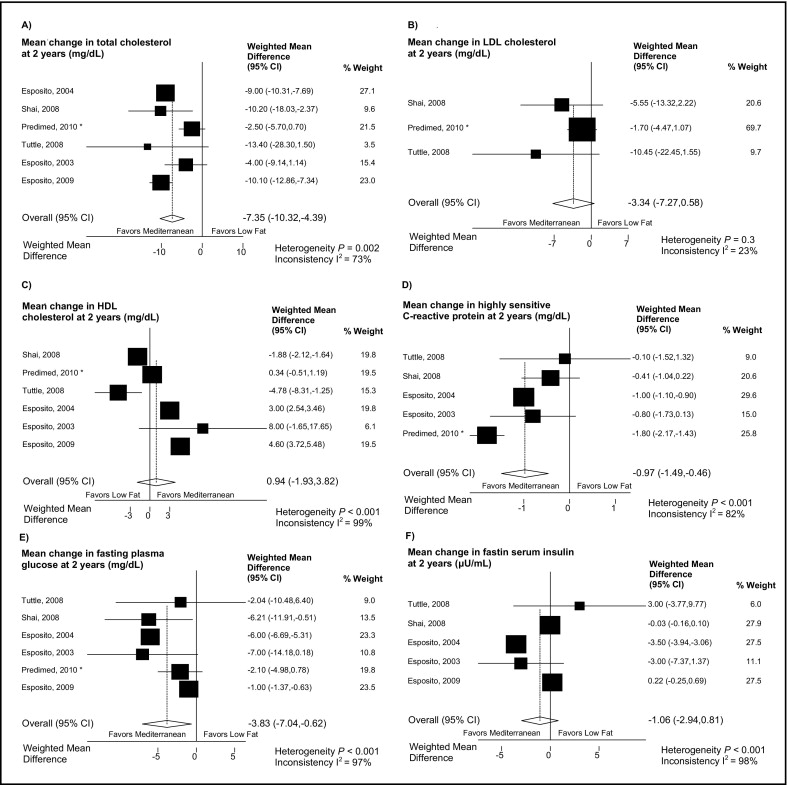
高感度 CRP (hs-CRP) は低脂肪食群に無作為割付された被験者よりも地中海料理群に無作為割付された被験者のほうがより順調に低下した.高感度 CRP の加重平均差は – 1.0 mg/L (95% CI, – 1.5 to – 0.5, P < 0.001, I2 = 82%) であった (Figure 3).
血糖値は低脂肪食群に無作為割付された被験者よりも地中海料理に無作為割付された被験者のほうがより順調に低下した (加重平均差 – 3.8 mg/dL, 95% CI, – 7.0 to – 0.6, P = 0.18, I2 = 97%) (Figure 3).2群間で血清インスリン値に統計的有意差はなかった (加重平均差 – 1.1 microU/ml, 95% CI, – 2.9 to 0.8, P < 0.001, I2 = 98%).
唯一臨床転帰を報告した試験があった.低脂肪食群において3名の非致死性心筋梗塞と1名の脳卒中が発生し,地中海料理群においては1名の非致死性心筋梗塞と3名の脳卒中が発生した.死亡例の報告はなかった.
我々が全ての試験について,治療法を隠して割り当てたり臨床転帰を盲検化したりして評価した試験に制限した時でも,点推定値には変化がなかった.メタ解析に Sinth らの試験結果を加えた時でもそうだった.
一次予防試験でも二次予防試験でも,転帰の点推定値の大部分は地中海料理に無作為割付した被験者を支持した.HDL コレステロール値における差異の点推定値は一次予防試験においてのみ地中海料理を支持したが,二次予防試験ではそうではなかった.ただしこれらの変化は統計的有意差がなかった.
我々は調整済み共同介入と無調整共同介入,毎日のカロリーを制限した群と制限しない群とを比較したが,どの心血管危険因子においても平均値の変化の点推定値に質的な差は認めなかった.どちらの群においても,調整済み共同介入試験や毎日のカロリーを制限した試験に限定する根拠は全くなくなってしまった.ただし BMI, ウエスト周囲径,HDL コレステロールは別である.
このメタ解析で利用可能な全ての無作為比較試験で,太り過ぎ又は肥満の個人を地中海料理と低脂肪食とで比較すると,殆どの心血管危険因子と血管炎症性マーカーとは地中海料理に割付された個人でより良く改善した.観察された差異は控えめであったものの,変化の方向性は地中海料理を一貫して支持するものであった.個々の試験全体に渡って観察された不均一性は,調整済み試験デザインに試験の解析を制限することや,両食事群において日々のカロリー摂取を制限することで除去されるだろう.臨床転帰の根拠は結論の出ないままである.臨床転帰を報告した試験が1つしかなかったからである.
現在の研究は強度と限界を有している.我々は包括的文献検索を行い,増加する心血管危険因子を個人において治療目的のデータを報告している無作為化比較試験を抽出した.それにより我々は幅広い心血管危険因子に対する2つの食事群のインパクトを評価した.正規の検定はいかなる出版バイアスも示していなかったが,相対的に少数の試験が含まれ,出版バイアスの検出力が低いため,そのようなバイアスは確実に除外しきれない.含めた試験のうち2つだけが全ての転帰のうち盲検化した転帰を報告したのだが,含まれる試験の結果は合理的に良いものであった.一つを除く他のすべてが隠蔽した治療割り付けを報告し,90% 以上の追跡率であったためである.加えて試験品質や人口の研究,共同介入を占める様々な感度解析に渡って我々の解析結果が堅牢であると証明された.
我々の解析にはいくつかの限界がある.たった6つの試験に基づいており,うち3つの試験は同じ著者グループから出版されたものである.我々は解析された転帰について最も著明な差異を観察した.しかしながら,調整済み共同介入試験に解析を限定しても大部分の心血管危険因子は地中海料理群により順調に修飾されており,BMI, ウエスト周囲径,HDL コレステロール値以外には心血管因子の不均一さにとって何の根拠も見いだせなかった.両食事群にカロリー制限を課した試験に解析を限定しても同じであった.
純粋に二次予防試験に限定した試験が1つだけ同定されたが,我々の結果は一次予防における心血管因子の修飾という点に限定していた.一次予防試験と二次予防試験との間では心血管危険因子の変化のいかなる主要な差異も感度解析では明らかではなかった.そのため,地中海料理は低脂肪食に比べて一次予防だけでなく二次予防にも優れているのではないかと示唆された.
規定の食事を遵守させるという参加者のクオリティ・オブ・ライフについて言及した試験は同定されなかった.故に,地中海食と低脂肪食に無作為割付された参加者の間での潜在的な生活の質の際についての情報が我々にはない.しかしながら,地中海料理と低脂肪食の持続率が近似しており,生活の質の差はそれほど大きくないのだろう.
我々のメタ解析の方法論では,心血管因子を一部有益に修飾するかもしれないという地中海料理のいかなる個別の要素にも至らなかった.我々のメタ解析の結果は,個別の食事の要素というよりも全体として特定の食事の型の方に注目してみると,心血管危険因子を低下させるのには地中海料理の不均一なパターンが有効である事を意味する.
我々が採用した試験は1つを例外に皆地中海諸国で行われたものである.低脂肪食に無作為割付された個人がある程度地中海式料理を続けているかもしれないため,我々の結果の強度に加わるかもしれない.一方,我々の結果を地中海諸国でない国に一般化することへの疑問も出てくる.
2つの食事間での臨床転帰の差を検出するのに提供された試験は1つもなかった.しかしながら,我々のメタ解析の所見は心血管疾病の転帰に対する地中海料理の効果を証明する前向きコホート研究によって支持されている.自分で食事パターンを選ばせたコホート研究による根拠というものは,しかしながら交絡によるバイアスを受けている.潜在的な交絡を除外するために,患者にとって重要な転帰についての特定の食事の効果を証明する無作為比較試験によるバイアスのない根拠が必要とされている.これまでのところ,地中海料理と低脂肪食の臨床転帰を比較した二次予防で,決して一次予防ではない試験というのは2つしか出版されていない.不幸なことに,これらの試験の1つの主任調査官の整合性について深刻な懸念が生じている.他の試験では,1994 年からの Lyon Diet Heart Studyなど,心臓死と非致死性心筋梗塞を組み合わせた一次エンドポイントは,平均27ヶ月間の経過観察後では 73% (95% CI, 41% – 88%) と印象的に減少している.Lyon Diet Heart Study はたった 41 例の主要転帰イベントの後,利益が明らかになるには早すぎる段階で終了してしまった.早期中止の利益は正味の健康上の利益を過大評価する結果となるかもしれない.加えて,Lyon Heart Diet Study に参加した患者の誰もが一度にスタチン療法を受けるのは難しかった.それゆえ,心血管イベント高リスク患者において,地中海料理の有益性がスタチン療法に次ぐのかどうかは不明のままである.
我々のメタ解析と2つの二次予防試験の限界のため,公衆衛生の観点からいや増す心血管リスクにおいて個人における地中海料理の実施を行う前に,更なる根拠が必要とされている.心血管危険因子に対して地中海料理において観察された有益な結果と心血管罹患率と死亡率は,最低でもあと1つ,心血管疾患が十分な予防試験で再現されなければならない.
まとめると,我々のメタ解析は,低脂肪食と比較して,大部分の心血管危険因子と炎症マーカーに対する地中海料理の順調な効果を示唆した.個別の危険因子に対する効果が観察されたものの,広範囲な心血管危険因子に渡る一貫した効果は,最終的に心血管転機に繋がる可能性もある.
Table 1 に採用した試験の特性をまとめた.1つの試験では冠動脈疾患と診断確定した患者だけを含めていた (26).1つの試験では肥満か,2型糖尿病であるか,あるいは心血管疾患であると確定診断した被験者を登録した (25).4つの試験は一次予防試験であり,肥満か,運動不足か,閉経後の女性か,メタボリックシンドロームで運動不足の被験者か,新たに診断された2型糖尿病で太り過ぎの被験者か,または心血管高リスク(2型糖尿病か,3つ以上の心血管危険因子を有する)の個人であった.後者の試験では地中海食に無作為割付された被験者は,1週間に 1 L のバージンオリーブオイルを提供されるか,無料のナッツ類 (30g/day) を提供されるかに無作為割付された.この解析のために我々は無料のバージンオリーブオイルと無料のナッツ類に割り付けられた被験者の間の差異なしに,2群を1つにまとめた.
採用した試験の経過観察期間は2年間のものが4つ,4年間のものが1つあった.PREDIMED trial は現在継続中であり,平均観察期間は6年間の予定である.我々はこの試験では検査値以外の解析には2年後のデータをメタ解析に採用した.検査値は1年後の観察後にしか採取しておらず,他の試験の2年目の脂質値はプールしてある.
試験参加者の割り付けは5つの試験で盲検化され,1つの試験でもおそらく盲検化されていた.すべての試験はオープンデザインであった.全ての転帰を盲検化した転帰の評価は2つの試験で行われ,検査値の解析のみ盲検化した試験が2つあった.1つの試験では全く盲検化が行われず,1つの試験ではどの転帰でも盲検化転帰評価を行ったか否か言及がなかった.観察から失われ脱落した参加者について全て記述してあったのは1つの試験で,部分的に記述してあったのは3つの試験だった.2つの試験では記述がなかった.6つの採用された試験のうち4つでは経過観察から脱落したのは 10 % 未満であった.有益性故に早期中止した試験はなかった.2名のレビュアーは採用した試験について方法論的質に全て賛同した.3つの試験では欠落したデータを説明してきた方法が不明のままであり,2つの試験では最終値を繰り越す方式であり,1つの試験ではマルチレベルランダム効果モデルであった.
森林を構成する樹木の分布と積算温度には対応が見られます.暖かい地方では冬の寒さが,寒い地方では夏の暑さが植物の分布を制約するためです.吉良竜夫はこの点に注目し,暖かさの指数warmth indexおよび寒さの指数coldness indexという温量指数を考案しました.
暖かさの指数とは『月平均気温が5℃を越す月の平均気温から5℃を引いた値の合計』です.寒さの指数とは『月平均気温が5℃未満の月について,月の平均気温と5℃との差の合計』でマイナスをつけて表現します.温量指数と言う場合,普通は暖かさの指数を指します.
日本の植生帯を特徴づける樹木の分布帯と暖かさの指数との関係をみると,180, 85, 45, 15のところにそれぞれの植生帯の上端(すなわち低温側の分布限界)が集中していると言われます.それに基づいて日本の気候は次のように分類されます.
気象庁のサイトでは日本全国の過去の気象データを蓄積しており,それらをダウンロードすることができます.今回は EXCEL VBA を用いて Web Query によりデータをダウンロードし,温量指数を計算する方法を述べます.
方法はこちらのページ(EXCEL VBAで気象庁ホームページから風向風速,降水量,気温,日照時間のデータをダウンロードする)に詳しいですが,同ページのコードが動かなかったため,再度マクロの記録から接続文字列などを検証しました.
まずは手動でダウンロードする場合です.気象庁の過去の気象データ検索ページを開きます.地点,年月日,データの種類で絞り込みます.任意の地点を選択します.ここで必要なのは月平均気温ですので,年月日は年を指定し,月と日は指定せずにおきます.データの種類は『****年の月ごとの値を表示』です.
ここでブラウザのURLを取得します.
https://www.data.jma.go.jp/obd/stats/etrn/view/monthly_a1.php?prec_no=55&block_no=0552&year=1977&month=&day=&view=p1
year= で年を指定しており,ここを変数化してループすればEXCELでデータを自動抽出できます.以下コードです.
Option Explicit

Sub WarmthIndex()

Dim mySht               As Worksheet
Dim myWeather(1048574, 15)  As Variant
Dim myURL               As String
Dim myYear              As Integer
Dim myMonth             As Integer
Dim myDate              As Date
Dim myRng               As Range
Dim myPlace             As String
Dim i                   As Integer
Dim j                   As Long
Dim myTime              As Single

    Application.ScreenUpdating = False
    j = 0
    myDate = Date
    myPlace = "**"
    myTime = Timer

    For myYear = 1977 To Year(myDate) - 1

        myURL = "URL;https://www.data.jma.go.jp/obd/stats/etrn/view/monthly_a1.php?prec_no=55&block_no=0552&year=" & myYear & "&month=&day=&view=p1"
        Set mySht = Worksheets.Add
        Set myRng = mySht.Range("$A$1")

        With mySht.QueryTables.Add(Connection:=myURL, Destination:=myRng)
            .WebSelectionType = xlSpecifiedTables
            .WebFormatting = xlWebFormattingNone
            .WebTables = """tablefix1"""
            .Refresh BackgroundQuery:=False
        End With

        Set myRng = myRng.CurrentRegion
        With myRng
            .Replace What:=" ", Replacement:=""
            .Replace What:="]", Replacement:=""
            .Replace What:=")", Replacement:=""
            .Replace What:="/", Replacement:=""
        End With

        For i = 0 To myRng.Rows.Count - 4
            myWeather(j, 0) = myPlace
            myWeather(j, 1) = myYear
            myWeather(j, 2) = myRng(i + 4, 1)
            myWeather(j, 3) = myRng(i + 4, 2)
            myWeather(j, 4) = myRng(i + 4, 3)
            myWeather(j, 5) = myRng(i + 4, 4)
            myWeather(j, 6) = myRng(i + 4, 6)
            myWeather(j, 7) = myRng(i + 4, 7)
            myWeather(j, 8) = myRng(i + 4, 8)
            myWeather(j, 9) = myRng(i + 4, 9)
            myWeather(j, 10) = myRng(i + 4, 10)
            myWeather(j, 11) = myRng(i + 4, 11)
            myWeather(j, 12) = myRng(i + 4, 12)
            myWeather(j, 13) = myRng(i + 4, 13)
            myWeather(j, 14) = myRng(i + 4, 16)
            Select Case True
            Case myRng(i + 4, 6) - 5 <= 0
                myWeather(j, 15) = 0
            Case Else
                myWeather(j, 15) = myRng(i + 4, 6) - 5
            End Select
            j = j + 1
        Next i

        Application.DisplayAlerts = False
        mySht.Delete
        Application.DisplayAlerts = True

    Next myYear

    Set mySht = Worksheets.Add
    With mySht
        .Name = myYear & myPlace & "温量指数"
        .Range("$A$1") = "地点"
        .Range("$B$1") = "年"
        .Range("$C$1") = "月"
        .Range("$D$1") = "降水量合計"
        .Range("$E$1") = "日最大降水量"
        .Range("$F$1") = "1時間最大降水量"
        .Range("$G$1") = "日平均気温"
        .Range("$H$1") = "日最高気温"
        .Range("$I$1") = "日最低気温"
        .Range("$J$1") = "最高気温"
        .Range("$K$1") = "最低気温"
        .Range("$L$1") = "平均風速"
        .Range("$M$1") = "最大風速"
        .Range("$N$1") = "最大風向"
        .Range("$O$1") = "日照時間"
        .Range("$P$1") = "温量指数"
        .Range("$A$2:$P$1048576") = myWeather
    End With

    Debug.Print Round(Timer - myTime, 2)
    Set myRng = Nothing
    Set mySht = Nothing
    Application.ScreenUpdating = True

End Sub
ピボットテーブルを挿入します.設定はデフォルトで結構です.『行』には年をドラッグします.『値』には温量指数をドラッグします.『集計方法』はデータの合計です.これで温量指数が算出されます.
グラフを追加するなら折れ線グラフが良いでしょう.下図は当地の温量指数の推移ですが,1987年までは95から105の範囲を推移していたのが,1988年から2004年までは95から115までの範囲を乱高下を繰り返し,2005年以降は110近辺の範囲に収まってきているように見えます.全体として温暖化傾向が見られます.

次に,夏枯れ指数を算出します.夏枯れ指数とは『日最高気温が25℃を超えた日について25℃との差を年間で合計した値』(武井和久)のことです.基準とした25℃は寒地型芝草が弱り始める温度です.コードのみ載せます.
Option Explicit

Sub SummerSlumpIndex()

Dim mySht               As Worksheet
Dim myWeather(1048574, 13)  As Variant
Dim myURL               As String
Dim myYear              As Integer
Dim myMonth             As Integer
Dim myDate              As Date
Dim myRng               As Range
Dim myPlace             As String
Dim i                   As Integer
Dim j                   As Long
Dim myTime              As Single

    Application.ScreenUpdating = False
    j = 0
    myDate = Date
    myPlace = "**"
    myTime = Timer

    For myYear = 1977 To Year(myDate) - 1

        On Error Resume Next
        If DateSerial(myYear, myMonth, 1) - DateSerial(Year(myDate), Month(myDate), 1) >= 0 Then
            Exit For
        End If
        On Error GoTo 0

        For myMonth = 1 To 12

            myURL = "URL;https://www.data.jma.go.jp/obd/stats/etrn/view/daily_a1.php?prec_no=55&block_no=0552&year=" & myYear & "&month=" & myMonth & "&day=&view=p1"
            Set mySht = Worksheets.Add
            Set myRng = mySht.Range("$A$1")

            With mySht.QueryTables.Add(Connection:=myURL, Destination:=myRng)
                .WebSelectionType = xlSpecifiedTables
                .WebFormatting = xlWebFormattingNone
                .WebTables = """tablefix1"""
                .Refresh BackgroundQuery:=False
            End With

            Set myRng = myRng.CurrentRegion
            With myRng
                .Replace What:=" ", Replacement:=""
                .Replace What:="]", Replacement:=""
                .Replace What:=")", Replacement:=""
                .Replace What:="/", Replacement:=""
            End With

            For i = 0 To myRng.Rows.Count - 4
                myWeather(j, 0) = myPlace
                myWeather(j, 1) = DateSerial(myYear, myMonth, myRng(i + 4, 1))
                myWeather(j, 2) = myRng(i + 4, 2)
                myWeather(j, 3) = myRng(i + 4, 3)
                myWeather(j, 4) = myRng(i + 4, 5)
                myWeather(j, 5) = myRng(i + 4, 6)
                myWeather(j, 6) = myRng(i + 4, 7)
                myWeather(j, 7) = myRng(i + 4, 8)
                myWeather(j, 8) = myRng(i + 4, 9)
                myWeather(j, 9) = myRng(i + 4, 10)
                myWeather(j, 10) = myRng(i + 4, 13)
                myWeather(j, 11) = myRng(i + 4, 14)
                Select Case True
                Case myRng(i + 4, 5) - 5 <= 0
                    myWeather(j, 12) = 0
                Case Else
                    myWeather(j, 12) = myRng(i + 4, 5) - 5
                End Select
                Select Case True
                Case myRng(i + 4, 6) - 25 <= 0
                    myWeather(j, 13) = 0
                Case Else
                    myWeather(j, 13) = myRng(i + 4, 6) - 25
                End Select
                j = j + 1
            Next i

            Application.DisplayAlerts = False
            mySht.Delete
            Application.DisplayAlerts = True

        Next myMonth
    Next myYear

    Set mySht = Worksheets.Add
    With mySht
        .Name = myYear & myPlace
        .Range("$A$1") = "地点"
        .Range("$B$1") = "年月日"
        .Range("$C$1") = "降水量合計"
        .Range("$D$1") = "1時間最大降水量"
        .Range("$E$1") = "平均気温"
        .Range("$F$1") = "最高気温"
        .Range("$G$1") = "最低気温"
        .Range("$H$1") = "平均風速"
        .Range("$I$1") = "最大風速"
        .Range("$J$1") = "最大風向"
        .Range("$K$1") = "最多風向"
        .Range("$L$1") = "日照時間"
        .Range("$M$1") = "温量指数"
        .Range("$N$1") = "夏枯れ指数"
        .Range("$A$2:$N$1048576") = myWeather
    End With

    Debug.Print Round(Timer - myTime, 2)
    Set myRng = Nothing
    Set mySht = Nothing
    Application.ScreenUpdating = True

End Sub
ピボットテーブルを挿入します.『行』には年月日をドラッグします.『値』には夏枯れ指数をドラッグします.『集計方法』はデータの合計です.更に『分析』タブの『グループの選択』コマンドをクリックし,『グループ化』ウィンドウで『年』のみを選択して年月日を集約します.これで夏枯れ指数が算出されます.同様に温暖化傾向が見られます.

The chemical name of vitamin B2 is riboflavin. The Dietary Reference Intakes of vitamin B2 has been set as amount of riboflavin. When vitamin B2 bind to a phosphoric acid, it becomes flavin mononucleotide (FMN). When FMN binds to AMP, it becomes Flavin adenine dinucleotide (FAD). They are both digested and absorbed in vitamin B2 and are shown as the equimolar of activity of vitamin B2.
Vitamin B2 is involved in energy metabolism and substance metabolism as coenzyme FMN and FAD. It is involved in such energy metabolism as TCA cycle, electron transport system and β-oxidation of fatty acids. Vitamin B2 deficiency causes growth suppression, stomatitis, angular cheilitis, glossitis and seborrheic dermatitis.
Most of riboflavin in foods are present as FAD and FMN, they will be released with cooking and gastric acid. The released FAD and FMN are hydrolyzed with FMN phosphatase and FAD pyrophosphatase of small intestine mucosa and absorbed into small intestine epithelial cells by active transport. The relative bioavailability of vitamin B2 in the diet in Japanese is reported 64 %.
Although there are two methods for determining the required amount of vitamin B2, minimum amount necessary to recover from the deficiency and the inflection point of the relationship between intake and urinary excretion, they are not consistent. They thought that the water soluble vitamin are not excreted into the urine until they meet the required amount and urinary excretion is increased rapidly when they exceeds the required amount and have set the inflection point as the required amount. When the intake is greater than 1.1 mg/d, vitamin B2 excretion into the urine is increased depending on the intake (pdf), it is considered as the required amount.
As vitamin B1, the minimum intake that excretion of vitamin B2 into the urine starts to increase has been set to the Estimated Average Requirement. Because the energy intake in the study was 2,200 kcal/d, the reference to calculate the Estimated Average Requirement in energy intake in 1-69 age is 0.50 mg/1,000 kcal. The Estimated Average Requirement has been calculated by multiplying the reference by the Estimated Energy Requirement in each age groups. The Recommended Amount has been calculated by multiplying the Estimated Average Requirement by recommended amount calculated coefficient 1.2.
Addition for pregnant has been calculated because the vitamin B2 is increased in response to the energy requirements. Additional energy of pregnant are 50 kcal/d in first trimester, 250 kcal/d in second trimester and 450 kcal/d in third trimester, respectively. The additional amount are multiplied them by the reference of Estimated Average Requirement, 0.50 mg/1,000 kcal, the results are 0.03 mg/d in first trimester, 0.13 mg/d in second trimester and 0.23 mg/d in third trimester, respectively. However, because the energy demand in pregnancy is different in each person and the metabolism enhance especially during pregnancy, the value of late pregnancy has been set to the necessary amount of the entire gestation period. The Estimated Average Requirement of addition for pregnant is rounded to 0.2 mg/d and the Recommended Amount is rounded to 0.3 mg/d, respectively.
The addition for lactation is set to 0.5 mg/d by multiplying the concentration of human milk 0.40 mg/L by milk yield 0.78 L/d and divided by the relative bioavailability of 60 %.
The Approximate Amount of 0-5 months infant is 0.31 mg/d by multiplying the concentration 0.40 mg/L in breast milk by the standard mammalian amount of 0.78 L/d and has been set to 0.3 mg/d by rounding. The Approximate Amount of 6-11 months infant has been set to 0.4 mg/d.
Even if an excess amount is absorbed, excess riboflavin are excreted rapidly into the urine and it is considered that the there is small effect of overdose, then the upper limit has not been set.
| Gender | Male | Female | ||||
|---|---|---|---|---|---|---|
| Age | Estimated Average Requirement | Recommended Amount | Approximate Amount | Estimated Average Requirement | Recommended Amount | Approximate Amount |
| 0-5 M | 0.3 | 0.3 | ||||
| 6-11 M | 0.4 | 0.4 | ||||
| 1-2 | 0.5 | 0.6 | 0.5 | 0.5 | ||
| 3-5 | 0.7 | 0.8 | 0.6 | 0.8 | ||
| 6-7 | 0.8 | 0.9 | 0.7 | 0.9 | ||
| 8-9 | 0.9 | 1.1 | 0.9 | 1.0 | ||
| 10-11 | 1.1 | 1.4 | 1.1 | 1.3 | ||
| 12-14 | 1.3 | 1.6 | 1.2 | 1.4 | ||
| 15-17 | 1.4 | 1.7 | 1.2 | 1.4 | ||
| 18-29 | 1.3 | 1.6 | 1.0 | 1.2 | ||
| 30-49 | 1.3 | 1.6 | 1.0 | 1.2 | ||
| 50-69 | 1.2 | 1.5 | 1.0 | 1.1 | ||
| 70- | 1.1 | 1.3 | 0.9 | 1.1 | ||
| Addition for pregnant | 0.2 | 0.3 | ||||
| Addition for lactation | 0.3 | 0.6 | ||||
| Gender | Male | Female | ||||
|---|---|---|---|---|---|---|
| Age | Estimated Average Requirement | Recommended Amount | Approximate Amount | Estimated Average Requirement | Recommended Amount | Approximate Amount |
| 0-5 M | 0.3 | 0.3 | ||||
| 6-11 M | 0.4 | 0.4 | ||||
| 1-2 | 0.5 | 0.6 | 0.5 | 0.5 | ||
| 3-5 | 0.7 | 0.8 | 0.6 | 0.8 | ||
| 6-7 | 0.8 | 0.9 | 0.7 | 0.9 | ||
| 8-9 | 0.9 | 1.1 | 0.9 | 1.0 | ||
| 10-11 | 1.1 | 1.4 | 1.0 | 1.2 | ||
| 12-14 | 1.3 | 1.5 | 1.1 | 1.4 | ||
| 15-17 | 1.4 | 1.7 | 1.1 | 1.4 | ||
| 18-29 | 1.3 | 1.6 | 1.0 | 1.2 | ||
| 30-49 | 1.3 | 1.6 | 1.0 | 1.2 | ||
| 50-69 | 1.2 | 1.5 | 1.0 | 1.2 | ||
| 70- | 1.1 | 1.3 | 0.9 | 1.1 | ||
| Addition for first trimester | 0.0 | 0.0 | ||||
| Addition for second trimester | 0.1 | 0.2 | ||||
| Addition for third trimester | 0.2 | 0.3 | ||||
| Addition for lactation | 0.3 | 0.4 | ||||
References:
The Dietary Reference Intakes for Japanese (2015 edition) Water solublr vitamin (pdf)
The Dietary Reference Intakes for Japanese (2010 edition) VItamin B2 (pdf)
ビタミン B2 の化学名はリボフラビンで食事摂取基準はシボフラビン量として設定されました.ビタミン B2 にリン酸が一つ結合したフラビンモノヌクレオチド (FMN) それに AMP が結合したフラビンアデニンジヌクレオチド (FAD) は共にビタミン B2 に消化されて吸収されるため,ビタミン B2 と当モルの活性を示します.
ビタミン B2 は補酵素 FMN および FAD としてエネルギー代謝や物質代謝に関わっています.TCA 回路,電子伝達系,脂肪酸の β 酸化などのエネルギー代謝に関わっており,ビタミン B 2 が欠乏すると成長抑制,口内炎,口角炎,舌炎,脂漏性皮膚炎を引き起こします.
食品中のリボフラビンは大半が FAD や FMN として存在しており,調理・胃酸の影響によりFAD, FMN は遊離します.遊離した FAD, FMN は小腸粘膜の FMN フォスファターゼおよび FAD ピロフォスファターゼにより加水分解されてリボフラビンになり,小腸上皮細胞から能動輸送により吸収されます.日本人における食事中のビタミン B2 の相対生体利用率は 64 % と報告されています.
ビタミン B2 の必要量を求める方法には,欠乏症からの回復に必要な最小量と,摂取量と尿中排泄量との関係式による変曲点とがありますが,両者の値は異なります.ここでは水溶性ビタミンは必要量を満たすまでは尿中に排泄されず,必要量を超えると急激に尿中排泄量が増大するとの考えから,変曲点を必要量とすることとします.摂取量が 1.1 mg/d を超えると摂取量に依存して尿中ビタミン B2 排泄量が増大する (pdf)ことから,これを必要量と考えます.
ビタミン B1 と同じく,尿中にビタミン B2 の排泄量が増加し始める最小摂取量を推定平均必要量としました.実験時のエネルギー摂取量が 2,200 kcal/d であったため,1-69 歳におけるエネルギー摂取量あたりの推定平均必要量を算定するための参照値は 0.50 mg/1,000 kcal です.この参照値に年齢区分ごとの推定エネルギー必要量を乗じて推定平均必要量を算定しました.推奨量は,推定平均必要量に推奨量算定係数 1.2 を乗じました.
妊婦の付加量はビタミン B2 がエネルギー要求量に応じて増大することから算定しました.妊娠によるエネルギー付加量は初期で 50 kcal/d 中期で 250 kcal/d, 後期で 450 kcal/d ですが,これらに推定平均必要量の参照値 0.50 mg/1,000 kcal を乗じると初期は 0.03 mg/d 中期は 0.13 mg/d, 後期は 0.23 mg/d となります.しかし妊娠期は個人によりエネルギー要求量が異なり,妊娠中は特に代謝が亢進するため,妊娠後期の値を全妊娠期間の必要量としました.妊婦の付加量の推定平均必要量は丸めて 0.2 mg/d とし,推奨量は 0.3 mg/d としました.
授乳婦の付加量は,母乳中の濃度 0.40 mg/L に泌乳量 0.78 L/d を乗じ,相対生体利用率 60 % で除して算出し,0.5 mg/d としました.
0-5 ヶ月児の乳児の目安量は母乳中の濃度 0.40 mg/L に基準哺乳量 0.78 L/d を乗じて 0.31 mg/d となり,丸めて 0.3 mg/d としました.6-11 ヶ月児の目安量は 0.4 mg/d としました.
リボフラビンは過剰量が吸収されても余剰は速やかに尿中に排泄され過剰摂取による影響を受けにくいため,耐用上限量は設定しませんでした.
| 性別 | 男性 | 女性 | ||||
|---|---|---|---|---|---|---|
| 年齢 | 推定平均必要量 | 推奨量 | 目安量 | 推定平均必要量 | 推奨量 | 目安量 |
| 0-5 M | 0.3 | 0.3 | ||||
| 6-11 M | 0.4 | 0.4 | ||||
| 1-2 | 0.5 | 0.6 | 0.5 | 0.5 | ||
| 3-5 | 0.7 | 0.8 | 0.6 | 0.8 | ||
| 6-7 | 0.8 | 0.9 | 0.7 | 0.9 | ||
| 8-9 | 0.9 | 1.1 | 0.9 | 1.0 | ||
| 10-11 | 1.1 | 1.4 | 1.1 | 1.3 | ||
| 12-14 | 1.3 | 1.6 | 1.2 | 1.4 | ||
| 15-17 | 1.4 | 1.7 | 1.2 | 1.4 | ||
| 18-29 | 1.3 | 1.6 | 1.0 | 1.2 | ||
| 30-49 | 1.3 | 1.6 | 1.0 | 1.2 | ||
| 50-69 | 1.2 | 1.5 | 1.0 | 1.1 | ||
| 70- | 1.1 | 1.3 | 0.9 | 1.1 | ||
| 妊婦付加量 | 0.2 | 0.3 | ||||
| 授乳婦付加量 | 0.3 | 0.6 | ||||
| 性別 | 男性 | 女性 | ||||
|---|---|---|---|---|---|---|
| 年齢 | 推定平均必要量 | 推奨量 | 目安量 | 推定平均必要量 | 推奨量 | 目安量 |
| 0-5 M | 0.3 | 0.3 | ||||
| 6-11 M | 0.4 | 0.4 | ||||
| 1-2 | 0.5 | 0.6 | 0.5 | 0.5 | ||
| 3-5 | 0.7 | 0.8 | 0.6 | 0.8 | ||
| 6-7 | 0.8 | 0.9 | 0.7 | 0.9 | ||
| 8-9 | 0.9 | 1.1 | 0.9 | 1.0 | ||
| 10-11 | 1.1 | 1.4 | 1.0 | 1.2 | ||
| 12-14 | 1.3 | 1.5 | 1.1 | 1.4 | ||
| 15-17 | 1.4 | 1.7 | 1.1 | 1.4 | ||
| 18-29 | 1.3 | 1.6 | 1.0 | 1.2 | ||
| 30-49 | 1.3 | 1.6 | 1.0 | 1.2 | ||
| 50-69 | 1.2 | 1.5 | 1.0 | 1.2 | ||
| 70- | 1.1 | 1.3 | 0.9 | 1.1 | ||
| 妊娠初期付加量 | 0.0 | 0.0 | ||||
| 妊娠中期付加量 | 0.1 | 0.2 | ||||
| 妊娠後期付加量 | 0.2 | 0.3 | ||||
| 授乳婦付加量 | 0.3 | 0.4 | ||||
参照:
日本人の食事摂取基準(2015 年版)水溶性ビタミン (pdf)
日本人の食事摂取基準(2010 年版)ビタミン B2 (pdf)
The chemical name of vitamin B1 is thiamine. The Dietary Reference Intakes for Japanese has set the amount of thiamine hydrochloride. Vitamin B1 is involved in glucose metabolism and branch amino acid metabolism, the deficiency of vitamin B1 causes beriberi and Wernicke-Korsakoff syndrome. The excess of vitamin B1 causes headache, irritation, insomnia, rapid pulse, weakened, contact dermatitis and itching.
Vitamin B1 in food is present bound to the enzyme protein as thiamine diphosphate (TDP). As foods is cooked and processed and enzyme protein is released from most of TDP with gastric acid, TDP is hydrolyzed in the digestive tract to thiamine and absorbed in the small intestine. The relative bioavailability of vitamin B1 has been reported 60%..
In adult and child, the required amount of vitamin B1 has been determined from the inflection point in the relationship between the urinary excretion and intake. In general, water soluble vitamins more than the required amount are excreted into the urine. The intake of vitamin B1 that increases to excrete into the urine has been determined the Estimated Average Requirement of vitamin B1. In the meta-analysis that has been reported in 18 countries, the inflection point is 0.35 mg/1,000 kcal as thiamine and 0.45 mg/1,000 kcal as thiamine hydrochloride. The point of value has been set to the reference value of the Estimated Average Requirement calculation of 1-69 years of age group, multiplied by Estimated Energy Requirement and determined Estimated Average Requirement. The recommended amount has been determined by multiplying the Estimated Average Requirement by Recommended Amount calculation coefficient 1.2.
Because energy requirements during pregnancy varies with each individual and the metabolism is enhanced, the additional amount 0.2 mg/d has been applied to the first trimester pregnancy and the second trimester pregnancy.
For the additional amount of lactation, the approximate amount has been set to 0.169 mg/d, with multiplying concentration in human milk 0.13 mg/L by milk yield 0.78 L/d and dividing by the relative bioavailability 60 % and rounded to 0.2 mg/d.
In 0-5 months infant, the approximate amount has been set to 0.10 mg/d by multiplying the concentration of human milk 0.13 mg/L by standard mammals amount 0.78 L/d. In 6-11 months infant, the approximate amount has been set to the rounded average between the extrapolated value of 0-5 months infant and the extrapolated amount of adult.
Although there are some reports of clinical symptoms with high intake of thiamine, it is insufficient to set the upper limit, therefore the upper limit has not been set.
| Gender | Male | Female | ||||
|---|---|---|---|---|---|---|
| Age | Estimated Average Requirement | Recommended Amount | Approximate Amount | Estimated Average Requirement | Recommended Amount | Approximate Amount |
| 0-5 M | 0.1 | 0.1 | ||||
| 6-11 M | 0.2 | 0.2 | ||||
| 1-2 | 0.4 | 0.5 | 0.4 | 0.5 | ||
| 3-5 | 0.6 | 0.7 | 0.6 | 0.7 | ||
| 6-7 | 0.7 | 0.8 | 0.7 | 0.8 | ||
| 8-9 | 0.8 | 1.0 | 0.8 | 0.9 | ||
| 10-11 | 1.0 | 1.2 | 0.9 | 1.1 | ||
| 12-14 | 1.2 | 1.4 | 1.1 | 1.3 | ||
| 15-17 | 1.3 | 1.5 | 1.0 | 1.2 | ||
| 18-29 | 1.2 | 1.4 | 0.9 | 1.1 | ||
| 30-49 | 1.2 | 1.4 | 0.9 | 1.1 | ||
| 50-69 | 1.1 | 1.3 | 0.9 | 1.0 | ||
| 70- | 1.0 | 1.2 | 0.8 | 0.9 | ||
| Addition for Pregnant | 0.2 | 0.2 | ||||
| Addition for Lactation | 0.2 | 0.2 | ||||
| Gender | Male | Female | ||||
|---|---|---|---|---|---|---|
| Age | Estimated Average Requirement | Recommended Amount | Approximate Amount | Estimated Average Requirement | Recommended Amount | Approximate Amount |
| 0-5 M | 0.1 | 0.1 | ||||
| 6-11 M | 0.3 | 0.3 | ||||
| 1-2 | 0.5 | 0.5 | 0.4 | 0.5 | ||
| 3-5 | 0.6 | 0.7 | 0.6 | 0.7 | ||
| 6-7 | 0.7 | 0.8 | 0.7 | 0.8 | ||
| 8-9 | 0.8 | 1.0 | 0.8 | 1.0 | ||
| 10-11 | 1.0 | 1.2 | 0.9 | 1.1 | ||
| 12-14 | 1.1 | 1.4 | 1.0 | 1.2 | ||
| 15-17 | 1.2 | 1.5 | 1.0 | 1.2 | ||
| 18-29 | 1.2 | 1.4 | 0.9 | 1.1 | ||
| 30-49 | 1.2 | 1.4 | 0.9 | 1.1 | ||
| 50-69 | 1.1 | 1.3 | 0.9 | 1.0 | ||
| 70- | 1.0 | 1.2 | 0.8 | 0.9 | ||
| Addition for First Trimester | 0.0 | 0.0 | ||||
| Addition for Second Trimester | 0.1 | 0.1 | ||||
| Addition for Third Trimester | 0.2 | 0.2 | ||||
| Addition for Lactation | 0.2 | 0.2 | ||||
References:
The Dietary Reference Intakes for Japanese (2015 edition) Water Soluble Vitamin (pdf)
The Dietary Reference Intakes for Japanese (2010 edition) Vitamin B1 (pdf)
ビタミン B1 の化学名はチアミンといいます.食事摂取基準ではチアミン塩酸塩量として設定しました.ビタミン B1 はグルコース代謝と分枝アミノ酸代謝に関与しており,欠乏により脚気,ウェルニッケ・コルサコフ症候群を起こします.ビタミン B1 過剰は頭痛,苛立ち,不眠,速脈,脆弱化,接触皮膚炎,痒みなどを起こします.
食品中のビタミン B1 はチアミンジリン酸 (TDP) として酵素たんぱく質と結合して存在しています.食品が調理加工され胃酸のもとで大部分の TDP から酵素たんぱく質が遊離し,消化管内で加水分解されてチアミンとなり,小腸で吸収されます.ビタミン B1 の相対生体利用率は 60 % と報告されています.
成人および小児について,ビタミン B1 の必要量を摂取量と尿中排泄量との関係式における変曲点から求めました.一般的に,水溶性ビタミンは必要量を超えると尿中に排泄されるようになります.尿中にビタミン B1 排泄量が増加し始める摂取量を推定平均必要量としました.18 ヶ国から報告されたデータをメタ解析すると,チアミンとして 0.35 mg/1,000 kcal, チアミン塩酸塩として 0.45 mg/1,000 kcal となります.この値を 1-69 歳の推定平均必要量算定の参照値とし,推定エネルギー必要量を乗じて推定平均必要量としました.推奨量は推定平均必要量に推奨量算定係数 1.2 を乗じて設定しました.
妊娠期のエネルギー要求量は個人により異なり,代謝が亢進するため,妊娠後期で算定した付加量 0.2 mg/d を妊娠前期・中期にも適用しました.
授乳婦の付加量については母乳中の濃度 0.13 mg/L に泌乳量 0.78 L/d を乗じ,相対生体利用率 60 % で除して 0.169 mg/d となり,丸めて 0.2 mg/d を目安量としました.
0-5 ヶ月児については母乳中の濃度 0.13 mg/L に基準哺乳量 0.78 L/d を乗じて 0.10 mg/d としました.6-11 ヶ月児については 0-5 ヶ月児からの外挿値と成人からの外挿値との平均値を丸め目安量としました.
チアミンを大量摂取した場合の臨床症状の報告はあるものの,耐用上限量を設定するに足る報告が十分でなく,設定しませんでした.
| 性別 | 男性 | 女性 | ||||
|---|---|---|---|---|---|---|
| 年齢 | 推定平均必要量 | 推奨量 | 目安量 | 推定平均必要量 | 推奨量 | 目安量 |
| 0-5 M | 0.1 | 0.1 | ||||
| 6-11 M | 0.2 | 0.2 | ||||
| 1-2 | 0.4 | 0.5 | 0.4 | 0.5 | ||
| 3-5 | 0.6 | 0.7 | 0.6 | 0.7 | ||
| 6-7 | 0.7 | 0.8 | 0.7 | 0.8 | ||
| 8-9 | 0.8 | 1.0 | 0.8 | 0.9 | ||
| 10-11 | 1.0 | 1.2 | 0.9 | 1.1 | ||
| 12-14 | 1.2 | 1.4 | 1.1 | 1.3 | ||
| 15-17 | 1.3 | 1.5 | 1.0 | 1.2 | ||
| 18-29 | 1.2 | 1.4 | 0.9 | 1.1 | ||
| 30-49 | 1.2 | 1.4 | 0.9 | 1.1 | ||
| 50-69 | 1.1 | 1.3 | 0.9 | 1.0 | ||
| 70- | 1.0 | 1.2 | 0.8 | 0.9 | ||
| 妊婦付加量 | 0.2 | 0.2 | ||||
| 授乳婦付加量 | 0.2 | 0.2 | ||||
| 性別 | 男性 | 女性 | ||||
|---|---|---|---|---|---|---|
| 年齢 | 推定平均必要量 | 推奨量 | 目安量 | 推定平均必要量 | 推奨量 | 目安量 |
| 0-5 M | 0.1 | 0.1 | ||||
| 6-11 M | 0.3 | 0.3 | ||||
| 1-2 | 0.5 | 0.5 | 0.4 | 0.5 | ||
| 3-5 | 0.6 | 0.7 | 0.6 | 0.7 | ||
| 6-7 | 0.7 | 0.8 | 0.7 | 0.8 | ||
| 8-9 | 0.8 | 1.0 | 0.8 | 1.0 | ||
| 10-11 | 1.0 | 1.2 | 0.9 | 1.1 | ||
| 12-14 | 1.1 | 1.4 | 1.0 | 1.2 | ||
| 15-17 | 1.2 | 1.5 | 1.0 | 1.2 | ||
| 18-29 | 1.2 | 1.4 | 0.9 | 1.1 | ||
| 30-49 | 1.2 | 1.4 | 0.9 | 1.1 | ||
| 50-69 | 1.1 | 1.3 | 0.9 | 1.0 | ||
| 70- | 1.0 | 1.2 | 0.8 | 0.9 | ||
| 前期妊婦付加量 | 0.0 | 0.0 | ||||
| 中期妊婦付加量 | 0.1 | 0.1 | ||||
| 後期妊婦婦付加量 | 0.2 | 0.2 | ||||
| 授乳婦付加量 | 0.2 | 0.2 | ||||
参照:
日本人の食事摂取基準(2015 年版)水溶性ビタミン (pdf)
日本人の食事摂取基準(2010 年版)ビタミン B1 (pdf)
| Gender | Male | Female |
|---|---|---|
| Age | Approximate amount | Approximate amount |
| 0-5 M | 4 | 4 |
| 6-11 M | 7 | 7 |
| 1-2 | 60 | 60 |
| 3-5 | 70 | 70 |
| 6-7 | 85 | 85 |
| 8-9 | 100 | 100 |
| 10-11 | 120 | 120 |
| 12-14 | 150 | 150 |
| 15-17 | 160 | 160 |
| 18-29 | 150 | 150 |
| 30-49 | 150 | 150 |
| 50-69 | 150 | 150 |
| 70- | 150 | 150 |
| Pregnant | 150 | |
| Lactation | 150 |
| Gender | Male | Female |
|---|---|---|
| Age | Approximate amount | Approximate amount |
| 0-5 M | 4 | 4 |
| 6-11 M | 7 | 7 |
| 1-2 | 25 | 25 |
| 3-5 | 30 | 30 |
| 6-7 | 40 | 40 |
| 8-9 | 45 | 45 |
| 10-11 | 55 | 55 |
| 12-14 | 70 | 65 |
| 15-17 | 80 | 60 |
| 18-29 | 75 | 60 |
| 30-49 | 75 | 65 |
| 50-69 | 75 | 65 |
| 70- | 75 | 65 |
| Addition for Pregnant | 0 | |
| Addition for Lactation | 0 |
The nutritionally important vitamin K are menaquinone-4 (vitamin K2) widely included in animal foods and menaquinone-7 produced by Bacillus Nattou. Vitamin K activates prothrombin and other clotting factor in the liver and promote blood clotting. Osteocalcin present in the bone is a vitamin K dependent protein and vitamin K activates it to adjust the bone formation. If vitamin K is insufficient, blood clotting is delayed. However, vitamin K deficiency does not occur in the normal diet.
It is not known that how much the vitamin K produced by intestinal bacteria and the vitamin K synthesis in the living tissue meets the requirements of vitamin K in human, it is known that the vitamin K does not meet the requirements of the living from the report, Vitamin K deficiency from dietary vitamin K restriction in humans.
Vitamin K deficiency leads to blood clotting delay. In clinical, surgery, oral warfarin administration and long-term administration of antibiotics may leads to vitamin K deficiency. However, it is not known that how much vitamin K intake is needed to activate blood clotting. It is considered that the required amount of vitamin K for prevention of fracture is greater than the required amount for activation of blood clotting factor.
Although the approximate amount of vitamin K has been set based on the report that the subjects are 10 Japanese young men, Vitamin K deficiency from dietary vitamin K restriction in humans in 2010 edition, the report has been denied in 2015 edition because of the few subjects.
In National Health and Nutrition Survey in 2010 and 2011, the average intakes of vitamin K are 185 µg/d and 280 µg/d, respectively. In Japanese, the intake of vitamin K depends on Natto and the vitamin K intakes are 336.2 ± 138.2 µg/d in Natto in eater and 154.1 ± 87.8 µg/d in non-Natto eater according to the report, Vitamin K Content of Foods and Dietary Vitamin K Intake in Japanese Young Women. The approximate amount of vitamin K has been set to 150 µg/d based on the report.
Although it is considered to elevate the approximate amount of vitamin K in elderly, it has been set to the same amount as in adults because of insufficient reports.
The approximate amount in child is extrapolated by estimating the body surface area with 0.75 square of the weight ratio. It is known that vitamin K is insufficient in newborn baby, therefore it leads to gastrointestinal bleeding a few days after birth and intracranial hemorrhage one month after birth. Therefore, oral administration of vitamin K are recommended immediately after birth in Japan. According to the recommendation, the approximate amount of vitamin K has been set to 4 µg/d by multiplying vitamin K concentration of human milk 5.17 µg/L by standard lactation amount 0.78 L/d in 0-5 months infant. It has been set to 7 µg/d in 6-11 months infant from view of the dietary intake.
There are few reports of vitamin K requirement in perinatal stage. It is considered that there is no difference of vitamin K requirement between pregnant and non-pregnant because it is difficult to pass through placenta for vitamin K, therefore it has been set to 150 µg/d. There is no reports that vitamin K is insufficient in lactation, therefore the approximate amount of vitamin K has also been set to 150 µg/d in lactation.
The toxicity due to high dose of vitamin K is not observed, therefore the upper limit has not been set.
The Dietary Reference Intakes for Japanese (2015 edition) Fat-soluble vitamin (pdf)
The Dietary Reference Intakes for Japanese (2010 edition) Vitamin K (pdf)
| 性別 | 男性 | 女性 |
|---|---|---|
| 年齢 | 目安量 | 目安量 |
| 0-5 M | 4 | 4 |
| 6-11 M | 7 | 7 |
| 1-2 | 60 | 60 |
| 3-5 | 70 | 70 |
| 6-7 | 85 | 85 |
| 8-9 | 100 | 100 |
| 10-11 | 120 | 120 |
| 12-14 | 150 | 150 |
| 15-17 | 160 | 160 |
| 18-29 | 150 | 150 |
| 30-49 | 150 | 150 |
| 50-69 | 150 | 150 |
| 70- | 150 | 150 |
| 妊婦 | 150 | |
| 授乳婦 | 150 |
| 性別 | 男性 | 女性 |
|---|---|---|
| 年齢 | 目安量 | 目安量 |
| 0-5 M | 4 | 4 |
| 6-11 M | 7 | 7 |
| 1-2 | 25 | 25 |
| 3-5 | 30 | 30 |
| 6-7 | 40 | 40 |
| 8-9 | 45 | 45 |
| 10-11 | 55 | 55 |
| 12-14 | 70 | 65 |
| 15-17 | 80 | 60 |
| 18-29 | 75 | 60 |
| 30-49 | 75 | 65 |
| 50-69 | 75 | 65 |
| 70- | 75 | 65 |
| 妊婦付加量 | 0 | |
| 授乳婦付加量 | 0 |
栄養上重要なビタミン K は動物性食品に広く分布するメナキノン-4 (ビタミン K2)と納豆菌の産生するメナキノン-7 です.ビタミン K は肝臓でプロトロンビンや他の血液凝固因子を活性化し血液凝固を促進します.骨に存在するオステオカルシンはビタミン K 依存性たんぱく質であり,ビタミン K はこれを活性化して骨形成を調節します.ビタミン K が不足すると血液凝固が遅延しますが,通常の食生活ではビタミン K 欠乏は起こりません.
腸内細菌によるビタミン K 産生や生体組織内でのビタミン K 合成がどの程度ヒトのビタミン K 必要量を満たしているかは分かっていませんが,生体の需要を満たすほど多くはないことは Vitamin K deficiency from dietary vitamin K restriction in humans という実験から分かっています.
ビタミン K 欠乏症が起きると血液凝固が遅延します.臨床的には手術後,ワーファリン内服中,抗生剤の長期投与後などにビタミン K 欠乏が起こります.しかし血液凝固因子の活性化に必要なビタミン K 摂取量は分かっていません.また骨折予防のために必要なビタミン K の量は血液凝固因子活性化よりも多いと考えられています.
日本人男性 10 名を対象にしたビタミン K 欠乏食を与えた Vitamin K deficiency from dietary vitamin K restriction in humans という研究があり,2010 年版ではそれを基にビタミン K の目安量を設定していますが,2015 年版では対象者数が少なく科学的根拠に乏しいとしています.
平成 22 年,23 年の国民健康・栄養調査でのビタミン K 摂取量の平均値はそれぞれ 185 µg/d, 280 µg/d です.日本人においては納豆を食べているか否かでビタミン K 摂取量に差があり,Vitamin K Content of Foods and Dietary Vitamin K Intake in Japanese Young Womenという報告では納豆摂取者のビタミン K 摂取量は 336.2 ± 138.2 µg/d, 納豆非摂取者で 154.1 ± 87.8 µg/d でした.これを基に 150 µg/d を目安量と設定しています.
高齢者においてはビタミン K の目安量を引き上げる必要があると考えられますが,報告が十分でないため目安量は成人と同じ値に設定されています.
小児の目安量は体重比の 0.75 乗を用いて体表面積を推定する方法で外挿しています.新生児はビタミン K 欠乏に陥りやすく,出生後数日で消化管出血をきたしたり,生後 1 ヶ月で頭蓋内出血を起こすことが知られています.そのため日本においては出生後直ちにビタミン K の経口摂取が行われています.それを前提として 0-5 ヶ月児では母乳中のビタミン K 濃度 5.17 µg/L に基準哺乳量 0.78 L/d を乗じて目安量を 4 µg/d と設定しました.6-11 ヶ月児では食事摂取を考慮して 7 µg/d を目安量に設定しました.
周産期におけるビタミン K 必要量を検討した資料はあまり存在しません.ビタミン K は胎盤を通過しにくいことから妊婦と非妊婦でビタミン K の必要量に差はないと考えられ,150 µg/d と設定しました.授乳婦においてビタミン K が不足するという報告はないため,同様に 150 µg/d と設定しました.
ビタミン K を大量摂取しても毒性は認められていません.そのため耐用上限量は設定されていません.
日本人の食事摂取基準(2015 年版)脂溶性ビタミン (pdf)
日本人の食事摂取基準(2010 年版)ビタミン K (pdf)
The most of vitamin E in human blood and tissue is &alpha tocopherol that localize in lipid bilayer membrane of the cell and protect unsaturated fatty acid and other components from oxidative damage. In animal experiments, vitamin E deficiency leads to infertility, encephalomalacia, liver necrosis, renal failure, hemolytic anemia and muscular dystrophy. The excess of vitamin E leads to bleeding tendency. There is no deficiency or excess of vitamin E in usual dietary intakes.
The reported absoption of vitamin E ranges from 21 % to 86 %, the exact rate of vitamin E absorption is not known. There is a National Health and Nutrition Survey in 2010 and 2011 for Japanese as a research for α tocopherol intake. In adults, the approximate amount has been set from median intake and in elderly, it has been set according to adults. Because there is no reports about approximate amount of vitamin E in child, then it has been set according to the such median intakes in National Health and Nutrition Survey as in adults. In 0-5 months Japanese infant, the approximate amount has been set with multiplying α tocopherol concentration by standard amount of breast milk and in 6-11 months infant, it has been set by extrapolating the body surface area of 0.75 square of body weight ratio, respectively. In pregnant and lactation, it has been set according to the median intakes of vitamin E in pregnant and lactation in the National Health and Nutrition Survey between 2007 and 2011. The upper limits have been set from extrapolating of the body weight ratio of reference weight in each age group.
| Gender | Male | Female | ||
|---|---|---|---|---|
| Age | Approximate amount | Upper limit | Approximate amount | Upper limit |
| 0-5 M | 3.0 | 3.0 | ||
| 6-11 M | 4.0 | 4.0 | ||
| 1-2 | 3.5 | 150 | 3.5 | 150 |
| 3-5 | 4.5 | 200 | 4.5 | 200 |
| 6-7 | 5.0 | 300 | 5.0 | 300 |
| 8-9 | 5.5 | 350 | 5.5 | 350 |
| 10-11 | 5.5 | 450 | 5.5 | 450 |
| 12-14 | 7.5 | 650 | 6.0 | 600 |
| 15-17 | 7.5 | 750 | 6.0 | 650 |
| 18-29 | 6.5 | 800 | 6.0 | 650 |
| 30-49 | 6.5 | 900 | 6.0 | 700 |
| 50-69 | 6.5 | 850 | 6.0 | 700 |
| 70- | 6.5 | 750 | 6.0 | 650 |
| Pregnant | 6.5 | |||
| Lactation | 7.0 | |||
| Gender | Male | Female | ||
|---|---|---|---|---|
| Age | Approximate amount | Upper limit | Approximate amount | Upper limit |
| 0-5 M | 3.0 | 3.0 | ||
| 6-11 M | 3.5 | 3.5 | ||
| 1-2 | 3.5 | 150 | 3.5 | 150 |
| 3-5 | 4.5 | 200 | 4.5 | 200 |
| 6-7 | 5.0 | 300 | 5.0 | 300 |
| 8-9 | 6.0 | 350 | 5.5 | 350 |
| 10-11 | 6.5 | 450 | 6.0 | 450 |
| 12-14 | 7.0 | 600 | 7.0 | 600 |
| 15-17 | 8.0 | 750 | 7.0 | 650 |
| 18-29 | 7.0 | 800 | 6.5 | 650 |
| 30-49 | 7.0 | 900 | 6.5 | 700 |
| 50-69 | 7.0 | 850 | 6.5 | 700 |
| 70- | 7.0 | 750 | 6.5 | 650 |
| Addition for Pregnant | 0.0 | |||
| Addition for Lactation | 3.0 | |||
The Dietary Reference Intakes for Japanese (2015 edition) Fat-soluble vitamin (pdf)
The Dietary Reference Intakes for Japanese (2010 edition) Vitamin E (pdf)
ヒトの血液および組織に存在するビタミン E は大部分が αトコフェロールであり,細胞の脂質二重膜内に存在し,不飽和脂肪酸や他の成分を酸化障害から防御しています.動物実験でビタミン E を欠乏させると不妊,脳軟化症,肝臓壊死,腎障害,溶血性貧血,筋ジストロフィーなどを発症します.ビタミン E 過剰症として出血傾向があります.通常の食事摂取ではビタミン E 欠乏や過剰が起こることはありません.
ビタミン E の吸収率は報告によって 21 % から 86 % までとまちまちであり,正確な吸収率は分かっていません.日本人を対象とした α トコフェロールの摂取量との調査として平成 22 年および 23 年の国民健康・栄養調査があります.成人では摂取量の中央値を元に目安量を設定し,高齢者もそれに準じて設定しています.小児のビタミン E の目安量に関するデータはなく,成人同様国民健康・栄養調査の中央値を目安量にしています.0-5 ヶ月の乳児については日本人母乳中の α トコフェロール濃度に基準哺乳量を乗じて目安量を設定しており,6-11 ヶ月の乳児については体重比の 0.75 乗で体表面積を外挿して目安量を設定しています.妊婦・授乳婦については平成 19 年から 23 年までの国民健康・栄養調査の妊婦・授乳婦のビタミン E 摂取量の中央値を元に設定しています.耐用上限量は年齢階級ごとに参照体重の体重比から外挿し設定しています.
| 性別 | 男性 | 女性 | ||
|---|---|---|---|---|
| 年齢 | 目安量 | 耐用上限量 | 目安量 | 耐用上限量 |
| 0-5 M | 3.0 | 3.0 | ||
| 6-11 M | 4.0 | 4.0 | ||
| 1-2 | 3.5 | 150 | 3.5 | 150 |
| 3-5 | 4.5 | 200 | 4.5 | 200 |
| 6-7 | 5.0 | 300 | 5.0 | 300 |
| 8-9 | 5.5 | 350 | 5.5 | 350 |
| 10-11 | 5.5 | 450 | 5.5 | 450 |
| 12-14 | 7.5 | 650 | 6.0 | 600 |
| 15-17 | 7.5 | 750 | 6.0 | 650 |
| 18-29 | 6.5 | 800 | 6.0 | 650 |
| 30-49 | 6.5 | 900 | 6.0 | 700 |
| 50-69 | 6.5 | 850 | 6.0 | 700 |
| 70- | 6.5 | 750 | 6.0 | 650 |
| 妊婦 | 6.5 | |||
| 授乳婦 | 7.0 | |||
| 性別 | 男性 | 女性 | ||
|---|---|---|---|---|
| 年齢 | 目安量 | 耐用上限量 | 目安量 | 耐用上限量 |
| 0-5 M | 3.0 | 3.0 | ||
| 6-11 M | 3.5 | 3.5 | ||
| 1-2 | 3.5 | 150 | 3.5 | 150 |
| 3-5 | 4.5 | 200 | 4.5 | 200 |
| 6-7 | 5.0 | 300 | 5.0 | 300 |
| 8-9 | 6.0 | 350 | 5.5 | 350 |
| 10-11 | 6.5 | 450 | 6.0 | 450 |
| 12-14 | 7.0 | 600 | 7.0 | 600 |
| 15-17 | 8.0 | 750 | 7.0 | 650 |
| 18-29 | 7.0 | 800 | 6.5 | 650 |
| 30-49 | 7.0 | 900 | 6.5 | 700 |
| 50-69 | 7.0 | 850 | 6.5 | 700 |
| 70- | 7.0 | 750 | 6.5 | 650 |
| 妊婦付加量 | 0.0 | |||
| 授乳婦付加量 | 3.0 | |||
日本人の食事摂取基準(2015 年版)脂溶性ビタミン (pdf)
日本人の食事摂取基準(2010 年版)ビタミン E (pdf)
The Dietary Reference Intakes of USA and Canada has set recommendation amount of vitamin D to 15 µg/d in adults. After subtraction 7.5 µg/d with produced by sun shine, residual 7.5 µg/d is considered to be required in a day. Although it is considered that there are many factors to be considered, because there is not sufficient evidence to change the approximate amount in the Dietary Reference Intakes for Japanese 2010 edition, it remains 5.5 µg/d. In the Dietary Reference Intakes for Japanese 2010 edition, approximate amount has been set to 5.5 µg/d based on the median intake in 50-69 age group in the National Health and Nutrition Survey in 2005 and 2006. Although the guidelines for treatment and prevention of osteoporosis 2011 edition has recommended 10-20 µg/d, the Dietary Reference Intakes for Japanese has set approximate amount to 5.5 µg/d because further studies are required to apply the entire elderly.
There are few studies for comparison between vitamin D intakes and vitamin D concentrations in child. Therefore, the approximate amount of child has been set by extrapolating body surface area from 0.75 square of weight ratio based on the approximate amount of adult.
The approximate amount of vitamin D in infant has been set from point of view of prevention of rickets, not vitamin D concentration in human milk. Although American Academy of Pediatrics has set to 5 µg/d for prevention of rickets in guideline in 2003, they have set to 10 µg/d in 2008. The Dietary Reference Intakes for Japanese has set the approximate amount in 0-5 months infant at 5 µg/d because the 2008 guideline of the American Academy of Pediatrics is hard to achieve. In 6-11 months infant with enough sunshine, the approximate amount has been set to 5 µg/d, without enough sunshine, it has also been set to 5 µg/d because there are few evidence, respectively.
Vitamin D deficiency was not observed with 7.0 µg/d or more intake in pregnant. Therefore, the approximate amount of pregnant has been set to 7.0 µg/d. The approximate amount of lactation has been set to 8.0 µg/d, added 2.5 µg/d, that vitamin D concentration 3.0 µg/L is multiplied by standard mammals amount 0.78 L/d, to the approximately amount in adult, 5.5 µg/d.
The upper limit of the dietary reference of vitamin D has been revised in 2015 edition, especially, the upper limit in adult has been revised from 50 µg/d to 100 µg/d, then the upper limit in infant and child has been revised. The scientific evidence is insufficient in vitamin D.
Vitamin D is absorbed from diet and produced by ultraviolet light in the skin. The effect of vitamin D is to promote absorption of calcium and phosphorus from the intestine and vitamin D deficiency leads to hypocalcemia. Then the result of it is secondary hyperparathyroidism, rickets in infant, osteomalacia in adults and osteoporosis in elderly. The excess of vitamin D leads to hypercalcemia, renal dysfunction and calcification of soft tissue.
| Gender | Male | Female | ||
|---|---|---|---|---|
| Age | Approximate amount | Upper limit | Approximate amount | Upper limit |
| 0-5 M | 5.0 | 25 | 5.0 | 25 |
| 6-11 M | 5.0 | 25 | 5.0 | 25 |
| 1-2 | 2.0 | 20 | 2.0 | 20 |
| 3-5 | 2.5 | 30 | 2.5 | 30 |
| 6-7 | 3.0 | 40 | 3.0 | 40 |
| 8-9 | 3.5 | 40 | 3.5 | 40 |
| 10-11 | 4.5 | 60 | 4.5 | 60 |
| 12-14 | 5.5 | 80 | 5.5 | 80 |
| 15-17 | 6.0 | 90 | 6.0 | 90 |
| 18-29 | 5.5 | 100 | 5.5 | 100 |
| 30-49 | 5.5 | 100 | 5.5 | 100 |
| 50-69 | 5.5 | 100 | 5.5 | 100 |
| 70- | 5.5 | 100 | 5.5 | 100 |
| Pregnant | 7.0 | |||
| Lactation | 8.0 | |||
| Gender | Male | Female | ||
|---|---|---|---|---|
| Age | Approximate amount | Upper limit | Approximate amount | Upper limit |
| 0-5 M | 2.5 (5.0) | 25 | 2.5 (5.0) | 25 |
| 6-11 M | 2.5 (5.0) | 25 | 2.5 (5.0) | 25 |
| 1-2 | 2.0 | 25 | 2.0 | 25 |
| 3-5 | 2.5 | 30 | 2.5 | 30 |
| 6-7 | 3.0 | 30 | 3.0 | 30 |
| 8-9 | 3.0 | 35 | 3.0 | 35 |
| 10-11 | 3.5 | 35 | 3.5 | 35 |
| 12-14 | 3.5 | 45 | 3.5 | 45 |
| 15-17 | 4.5 | 50 | 4.5 | 50 |
| 18-29 | 5.5 | 50 | 5.5 | 50 |
| 30-49 | 5.5 | 50 | 5.5 | 50 |
| 50-69 | 5.5 | 50 | 5.5 | 50 |
| 70- | 5.5 | 50 | 5.5 | 50 |
| Addition for Pregnant | 1.5 | |||
| Addition for Lactation | 2.5 | |||
References:
The Dietary Reference Intakes for Japanese (2015 edition) Fat-soluble vitamin (pdf)
The Dietary Reference Intakes for Japanese (2010 edition) Vitamin D (pdf)
アメリカ・カナダの食事摂取基準では成人のビタミン D の推奨量を 15 µg/d としています.日照による産生されるビタミン D 7.5 µg/d を差し引いた 7.5 µg/d が 1 日における必要量と考えられますが,その他にも考慮すべき要因が多数あると考えられ,2010 年版の日本人の食事摂取基準の目安量を変更するに足る根拠がなく 5.5 µg/d のままとなっています.2010 年版では平成 17 年および 18 年の国民健康・栄養調査の 50-69 歳の摂取量の中央値を基に 5.5 µg/d を目安量に設定しています.骨粗鬆症の予防と治療ガイドライン 2011 年版では 10-20 µg/d を推奨していますが,高齢者全体に適用できるか否かは更に検討を要するとして成人と同じ 5.5 µg/d を目安量としています.
小児についてはビタミン D 摂取量と血中濃度の比較を行った研究に乏しく,成人の目安量から体重比の 0.75 乗を用いて体表面積を外挿し小児の目安量を設定しました.
乳児については母乳中のビタミン D 濃度から目安量を算出するのではなく,くる病防止の観点から目安量を設定しました.アメリカ小児科学会では 2003 年のガイドラインにおいてくる病防止のため 5 µg/d を設定しましたが,2008 年のガイドラインでは 10 µg/d と設定しました.2008 年のガイドラインは実現困難として 0-5 ヶ月児の目安量を 5 µg/d と設定しました.6-11 ヶ月児については十分な日照を受けられる場合 5 µg/d と設定し,十分ない日照を受けられない場合もデータが不十分なため 5 µg/d と設定しました.
妊婦については 7.0 µg/d 以上のビタミン D 摂取量ではビタミン D 不足は認められなかったことから,目安量を 7.0 µg/d と設定しました.授乳婦については母乳中のビタミン D 濃度 3.0 µg/L に基準哺乳量 0.78 L/d を乗じて丸めを行った 2.5 µg/d を成人の目安量に加え, 8.0 µg/d としました.
ビタミン D の食事摂取基準は 2010 年版と 2015 年版では耐用上限量が変更されています.主に成人の耐用上限量が 50 µg/d から 100 µg/d に変更されています.それに伴い,小児における耐用上限量も変更されています.ビタミン D については参考となる報告が不足しており,研究の充実が求められています.
ビタミン D は食事から摂取されるほか,皮膚で紫外線により生成されます.ビタミン D の作用は腸管からのカルシウムとリンの吸収を促進することであり,ビタミン D が欠乏すると低カルシウム血症となります.その結果二次性副甲状腺機能亢進症となり,小児ではくる病,成人では骨軟化症,高齢者では骨粗鬆症となります.ビタミン D 過剰では高カルシウム血症,腎障害,軟組織の石灰化を引き起こします.
| 性別 | 男性 | 女性 | ||
|---|---|---|---|---|
| 年齢 | 目安量 | 耐用上限量 | 目安量 | 耐用上限量 |
| 0-5 M | 5.0 | 25 | 5.0 | 25 |
| 6-11 M | 5.0 | 25 | 5.0 | 25 |
| 1-2 | 2.0 | 20 | 2.0 | 20 |
| 3-5 | 2.5 | 30 | 2.5 | 30 |
| 6-7 | 3.0 | 40 | 3.0 | 40 |
| 8-9 | 3.5 | 40 | 3.5 | 40 |
| 10-11 | 4.5 | 60 | 4.5 | 60 |
| 12-14 | 5.5 | 80 | 5.5 | 80 |
| 15-17 | 6.0 | 90 | 6.0 | 90 |
| 18-29 | 5.5 | 100 | 5.5 | 100 |
| 30-49 | 5.5 | 100 | 5.5 | 100 |
| 50-69 | 5.5 | 100 | 5.5 | 100 |
| 70- | 5.5 | 100 | 5.5 | 100 |
| 妊婦 | 7.0 | |||
| 授乳婦 | 8.0 | |||
| 性別 | 男性 | 女性 | ||
|---|---|---|---|---|
| 年齢 | 目安量 | 耐用上限量 | 目安量 | 耐用上限量 |
| 0-5 M | 2.5 (5.0) | 25 | 2.5 (5.0) | 25 |
| 6-11 M | 2.5 (5.0) | 25 | 2.5 (5.0) | 25 |
| 1-2 | 2.0 | 25 | 2.0 | 25 |
| 3-5 | 2.5 | 30 | 2.5 | 30 |
| 6-7 | 3.0 | 30 | 3.0 | 30 |
| 8-9 | 3.0 | 35 | 3.0 | 35 |
| 10-11 | 3.5 | 35 | 3.5 | 35 |
| 12-14 | 3.5 | 45 | 3.5 | 45 |
| 15-17 | 4.5 | 50 | 4.5 | 50 |
| 18-29 | 5.5 | 50 | 5.5 | 50 |
| 30-49 | 5.5 | 50 | 5.5 | 50 |
| 50-69 | 5.5 | 50 | 5.5 | 50 |
| 70- | 5.5 | 50 | 5.5 | 50 |
| 妊婦付加量 | 1.5 | |||
| 授乳婦付加量 | 2.5 | |||
参照:
日本人の食事摂取基準(2015 年版)脂溶性ビタミン (pdf)
日本人の食事摂取基準(2010 年版)ビタミン D (pdf)