ガウスの発散定理とも呼ばれる定理です.発散を,ベクトル場 内における容積 V の単位体積あたりの湧出量と捉えると,定理の左辺の意味は『容積 V 内全体での流量の変化量』を表わすと考えられ,右辺は『この容積 V の表面 S における の法線方向成分』と考えられます.流量には水流,電場,磁場などを考えます.
In many intervention trial in America and Europe, decreasing saturated fatty acid intakes have been recognized to decrease coronary heart disease morbidity, atherosclerosis and LDL cholesterol. In JPHC trial for Japanese, positive correlation has been observed between saturated fatty acid and the onset of myocardial infarction. However, it is not clear whether the decrease of saturated fatty acid intake causes the increase of cerebral hemorrhage.
Adult
It is considered that excessive intake of saturated fatty acids is the risk of atherosclerosis, especially myocardial infarction. In order to prevent of the onset and the aggravation, it’s important not only to limit the intake of saturated fatty acids but also to increase of intake of unsaturated fatty acids. In each country, saturated fatty acids intake in adult has been recommended less than 10 %E. American Heart Association and American Diabetes Association have been recommended less than 7 %E. In National Health and Nutrition Survey in 2011, saturated fatty acids intake of 20 years old or older Japanese was 6.9 %E. Therefore, the target amount of saturated fatty acids in adults has been set to less than 7 %E.
Child
Although it is considered that saturated fatty acid s intake should be less than 7 %E because the excessive intake of saturated fatty acids in child may cause coronary heart disease and obesity in middle age, research and related epidemiological studies and intervention trials were not enough to set the target amount of saturated fatty acids in child.
The Dietary Reference Intakes of saturated fatty acids 2015 edition and 2010 edition are following tables. They have not been set in infant, child, pregnant and lactation.
The Dietary Reference Intakes of saturated fatty acids (% energy) (2015 edition)
Gender
Male
Female
Age
Target Amount
Target Amount
0-5 M
6-11 M
1-2
3-5
6-7
8-9
10-11
12-14
15-17
18-29
≤7
≤7
30-49
≤7
≤7
50-69
≤7
≤7
70-
≤7
≤7
Addition for Pregnant
Addition for lactation
The Dietary Reference Intakes of saturated fatty acids (% energy) (2010 edition)
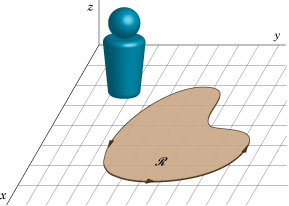
Let be a two-sided surface having projection on the plane as in the adjoining Fig. 6-3. Assume that an equation for is , where is single-valued and continuous for all and in . Divide into subregions of area , and erect a vertical column on each of these subregions to intersect in an area .
Let be single-valued and continuous at all points of . Form the sum
where is some point of . If the limit of this sum as in such a way that each exists, the resulting limit is called the surface integral of over and is designated by
Since approximately, where is the angle between the normal line to and the positive axis, the limit of the sum (29) can be written
The quantity is given by
Then assuming that has continuous (or sectionally continuous) derivatives in , (31) can be written in rectangular form as
In case the equation for is given as , (33) can also be written
The results (33) or (34) can be used to evaluate (30).
In the above we have assumed that is such that any line parallel to the axis intersects in only one point. In case is not of this type, we can usually subdivide into surfaces which are of this type. Then the surface integral over is defined as the sum of the surface integrals over
The results stated hold when is projected on to a region of the plane. In some cases it is better to project on to the or planes. For such cases (30) can be evaluated by appropriately modifying (33) and (34).
The Dietary Reference Intakes have been set in lipids, saturated fatty acids, n-6 fatty acids and n-3 fatty acids. They have not been set in monounsaturated fatty acids, trans fatty acids, conjugated linoleic acid, diacylglycerol, medium chain triacylglycerol, plant sterols and cholesterol.
Especially, the Dietary Reference Intakes had been set for cholesterol in 2010 edition, such as 750 mg/d in male and 600 mg/d in female, they have been deleted in 2015 edition.
Lipid (fat energy ratio)
The Dietary Reference Intakes of lipid in 2015 edition and 2010 edition, the ratio of lipid in total energy (fat energy ratio), are following tables. The target amount in age group of grater than 30 years old has been revised. The Dietary Reference Intakes for pregnant and lactation have not been set.
The Dietary Reference Intakes of Lipid (% energy) (2015 edition)
Gender
Male
Female
Age
Approximate amount
Target amount (Median)
Approximate amount
Target amount (Median)
0-5 M
50
50
6-11 M
40
40
1-2
20-30 (25)
20-30 (25)
3-5
20-30 (25)
20-30 (25)
6-7
20-30 (25)
20-30 (25)
8-9
20-30 (25)
20-30 (25)
10-11
20-30 (25)
20-30 (25)
12-14
20-30 (25)
20-30 (25)
15-17
20-30 (25)
20-30 (25)
18-29
20-30 (25)
20-30 (25)
30-49
20-30 (25)
20-30 (25)
50-69
20-30 (25)
20-30 (25)
70-
20-30 (25)
20-30 (25)
Pregnant
Lactation
The Dietary Reference Intakes of Lipid (% energy) (2010 edition)
A necessary and sufficient condition for to be independent of the path joining any two given points in a region is that in
where it is supposed that these partial derivatives are continuous in .
The condition (23) is also the condition that is an exact differential, i.e. that there exists a function such that . In such case if the end points of curve are and , the value of the line integral is given by
In particular if (23) holds and is closed, we have and
The results in Theorem 6-1 can be extended to line integrals in space. Thus we have
Theorem 6-2.
A necessary and sufficient condition for to be independent of the path joining any two given points in a region is that in
where it is supposed that these partial derivatives are continuous in .
The results can be expressed concisely in terms of vectors. If , the line integral can be written and condition (26) is equivalent to the condition . If represents a force field which acts on an object, the result is equivalent to the statement that the work done in moving the object from one point to another is independent of the path joining the two points if and only if . Such a force field is often called conservative.
The condition (26) [or the equivalent condition ] is also the condition that [or ] is an exact differential, i.e. that there exists a function such that . In such case if the endpoints of curve are and , the value of the line integral is given by
The reports of protein have 9 pages and 73 references in 2010 edition and 14 pages and 119 references in 2015 edition, respectively.
Although upper limit of protein intake is not set in 2010 edition, it’s preferred that protein intake is less than 2.0 g/kg/d in adult.
It is focused on severity of disease in 2015 edition. If protein-energy ratio was greater than 20 % energy, the risk of diabetes, cardiovascular disease, the incidence of cancer, bone loss and the increase of BMI would develop. Then it should be noted that protein-energy ratio should not be more than 20 % energy.
Estimated Average Requirement of indispensable amino acids (essential amino acids) has been described for only adult in 2010 edition and they have been described not only for adult but also for child and infant in 2015 edition, respectively.
Dietary reference intakes of the proteins of the 2015 edition is as follow table.
Dietary Reference Intakes of the proteins (g/d), Target (median) % energy) 2015 edition
Gender
Male
Female
Age
Estimated Average Requirement
Recommended amount
Approximate amount
Target amount (Median)
Estimated Average Requirement
Recommended amount
Approximate amount
Target amount (Median)
0-5 M
10
10
6-8 M
15
15
9-11 M
25
25
1-2
15
20
13-20 (16.5)
15
20
13-20 (16.5)
3-5
20
25
13-20 (16.5)
20
25
13-20 (16.5)
6-7
25
35
13-20 (16.5)
25
30
13-20 (16.5)
8-9
35
40
13-20 (16.5)
30
40
13-20 (16.5)
10-11
40
50
13-20 (16.5)
40
50
13-20 (16.5)
12-14
50
60
13-20 (16.5)
45
55
13-20 (16.5)
15-17
50
65
13-20 (16.5)
45
55
13-20 (16.5)
18-29
50
60
13-20 (16.5)
40
50
13-20 (16.5)
30-49
50
60
13-20 (16.5)
40
50
13-20 (16.5)
50-69
50
60
13-20 (16.5)
40
50
13-20 (16.5)
70-
50
60
13-20 (16.5)
40
50
13-20 (16.5)
Additional protein in early pregnant
0
0
Additional protein in mid pregnant
5
10
Additional protein in late pregnant
20
25
Additional protein in lactation
15
20
Dietary reference intakes of the proteins of the 2010 edition is as follow table.
Dietary Reference Intakes of the proteins (g/d) 2010 edition
Gender
Male
Female
Age
Estimated Average Requirement
Recommended amount
Approximate amount
Upper limit amount
Estimated Average Requirement
Recommended amount
Approximate amount
Upper limit amount
0-5 M
10
10
6-8 M
15
15
9-11 M
25
25
1-2
15
20
15
20
3-5
20
25
20
25
6-7
25
30
25
30
8-9
30
40
30
40
10-11
40
45
35
45
12-14
45
60
45
55
15-17
50
60
45
55
18-29
50
60
40
50
30-49
50
60
40
50
50-69
50
60
40
50
70-
50
60
40
50
Additional protein in early pregnant
0
0
Additional protein in mid pregnant
5
10
Additional protein in late pregnant
20
25
Additional protein in lactation
15
20
The recommended amount is based on the proteins maintain the required amount from nitrogen balance experiment, corrected in the digestibility of daily meal mixed protein, used to calculate the reference value of the Estimated Average Requirement calculation and is calculated the recommended amount by the addition of interindividual variability.
Recommended amount of protein (g/d) is product of Estimated Average Requirement and Recommended amount calculated coefficient. The Estimated Average Requirement is product of Reference value of the Estimated Average Requirement Calculation (g/kg/d) and reference weight (kg). Reference value of the Estimated Average Requirement calculation is obtained by dividing protein maintain the required amount (g/kg/d) by the digestibility.
Recommended amount calculated coefficient is 1.25. The digestibility is 0.9.
Adult
The proteins maintain the required amount of adult, that has been determined from the average of 17 studies examined the nitrogen balance maintenance dose of animal protein, is 0.65 g/kg/d, divided it by the digestibility 0.9, Reference value of the Estimated Average Requirement Calculation is obtained as 0.72 g/kg/d.
Elderly
Estimated Average Requirement of protein of elderly, that have been calculated from the pooled analysis using 144 data nitrogen balance of 60 subjects of five studies, is 0.85 g/kg/d (corrected by the digestibility).
Child
The reference value for calculation of Estimated Average Requirement in child the sum of the required amount of protein maintenance and the amount of protein accumulation. The Estimated Average Requirement is the product of the reference value for calculation of Estimated Average Requirement and reference weight. The recommended amount is the product of the Estimated Average Requirement and recommended amount calculation coefficient 1.25. The required amount of protein maintain is 0.67 g/kg/d.
Estimated Average Requirement and recommended amount of protein about child is following table. Predictive equation following is correct in 2015 edition, although predictive equation of 2010 edition is wrong.
Estimated Average Requirement and recommended amount of protein about child 2015 edition
Male child
A
B
C
D
E
F
G
H
I
Age (Y)
Reference weight (kg)
Weight gain (kg/Y)
Body protein (%)
Body protein accumulation (g/kg/d)
Accumulation efficiency (%)
Proteins maintain the required amount (g/kg/d)
Utilization efficiency (%)
Estimated Average Requirement (g/d)
Recommended amount (g/d)
1-2
11.5
2.1
13.2
0.064
40
0.67
70
12.9
16.1
3-5
16.5
2.1
14.7
0.050
40
0.67
70
17.9
22.3
6-7
22.2
2.7
15.5
0.051
40
0.67
70
24.1
30.1
8-9
28.0
3.2
14.5
0.046
40
0.67
70
30.0
37.5
10-11
35.6
4.7
13.9
0.050
40
0.67
75
36.3
45.3
12-14
49.0
5.1
13.9
0.039
40
0.67
80
45.9
57.3
15-17
59.7
2.0
15.0
0.014
40
0.67
85
49.1
61.4
Female child
A
B
C
D
E
F
G
H
I
Age (Y)
Reference weight (kg)
Weight gain (kg/Y)
Body protein (%)
Body protein accumulation (g/kg/d)
Accumulation efficiency (%)
Proteins maintain the required amount (g/kg/d)
Utilization efficiency (%)
Estimated Average Requirement (g/d)
Recommended amount (g/d)
1-2
11.0
2.2
13.0
0.070
40
0.67
70
12.5
15.6
3-5
16.1
2.1
14.1
0.051
40
0.67
70
17.5
21.8
6-7
21.9
2.5
14.1
0.045
40
0.67
70
23.4
29.3
8-9
27.4
3.4
13.7
0.046
40
0.67
70
29.4
36.7
10-11
36.3
5.1
14.6
0.057
40
0.67
75
37.6
47.0
12-14
47.5
3.0
14.8
0.026
40
0.67
80
42.8
53.6
15-17
51.9
0.7
11.9
0.004
40
0.67
85
41.5
51.8
Infant
The target amount of protein in infant in human milk is 9.83 g/d in 0-5 months, 12.5 g/d in 6-8 months and 22.0 g/d in 9-11 months, respectively. The target amount in artificial feeding is 14.0 g/d in 0-5 months, 15.2 g/d in 6-8 months and 23.8 g/d in 9-11 months, respectively.
Pregnant
It’s assumed that the weight gain in full-term is 11.0 kg in pregnant. The additional protein is obtained indirectly by calculating the body potassium increased amount. Estimated Average Requirement is 0 g/d in early pregnant, 4.51 g/d in mid pregnant and 18.98 g/d in late pregnant, respectively. The recommended amount of additional protein is 0 g/d in early pregnant, 5.64 g/d in mid pregnant and 23.73 g/d in late pregnant, respectively.
Lactation
Estimated Average Requirement of lactation is 14.04 g/d and recommended amount is 17.6 g/d, respectively. The average milk yield per day is 0.78 L/d and the average of the protein concentration in human milk is 12.6 g/L, respectively. Conversion efficiency of human milk protein from dietary protein is 70 %.
Estimated energy requirement (EER) in 2015 edition is as following table.
Estimated Energy Requirement (kcal/d)
Gender
Male
Female
Physical Activity Level
I
II
III
I
II
III
0-5 (M)
550
500
6-8 (M)
650
600
9-11 (M)
700
650
1-2
950
900
3-5
1,300
1,250
6-7
1,350
1,550
1,750
1,250
1,450
1,650
8-9
1,600
1,850
2,100
1,500
1,700
1,900
10-11
1,950
2,250
2,500
1,850
2,100
2,350
12-14
2,300
2,600
2,900
2,150
2,400
2,700
15-17
2,500
2,850
3,150
2,050
2,300
2,550
18-29
2,300
2,650
3,050
1,650
1,950
2,200
30-49
2,300
2,650
3,050
1,750
2,000
2,300
50-69
2,100
2,450
2,800
1,650
1,900
2,200
70-
1,850
2,200
2,500
1,500
1,750
2,000
Additional Energy in Early Gestation
+ 50
+ 50
+ 50
Additional Energy in Midgestation
+ 250
+ 250
+ 250
Additional Energy in Late Gestation
+ 450
+ 450
+ 450
Additional Energy in Lactation
+ 350
+ 350
+ 350
Basal Metabolic Rate
Basal metabolic rate (BMR) for Japanese is based on basal metabolism reference value (BMRV). BMR is obtained by BMRV multiplied by reference weight (RW).
BMR in 2015 edition is as following table. A little difference is found in reference weight between 2010 edition and 2015 edition.
Basal Metabolic Rate in Reference weight
Gender
Male
Female
Age (years)
BMRV (kcal/kg/d)
RW (kg)
BMR (kcal/d)
BMRV (kcal/kg/d)
RW (kg)
BMR (kcal/d)
1-2
61.0
11.5
700
59.7
11.0
660
3-5
54.8
16.5
900
52.2
16.1
840
6-7
44.3
22.2
980
41.9
21.9
920
8-9
40.8
28.0
1140
38.3
27.4
1050
10-11
37.4
35.6
1330
34.8
36.3
1260
12-14
31.0
49.0
1520
29.6
47.5
1410
15-17
27.0
59.7
1610
25.3
51.9
1310
18-29
24.0
63.2
1520
22.1
50.0
1110
30-49
22.3
68.5
1530
21.7
53.1
1150
50-69
21.5
65.3
1400
20.7
53.0
1100
70-
21.5
60.0
1290
20.7
49.5
1020
Basal metabolic rate in 2010 edition is as following table.
Basal Metabolic Rate in Standard Weight
Gender
Male
Female
Age (years)
BMRV (kcal/kg/d)
RW (kg)
BMR (kcal/d)
BMRV (kcal/kg/d)
RW (kg)
BMR (kcal/d)
1-2
61.0
11.7
710
59.7
11.0
660
3-5
54.8
16.8
890
52.2
16.2
850
6-7
44.3
22.0
980
41.9
22.0
920
8-9
40.8
27.5
1120
38.3
27.2
1040
10-11
37.4
35.5
1330
34.8
34.5
1200
12-14
31.0
48.0
1490
29.6
46.0
1360
15-17
27.0
58.4
1580
25.3
50.6
1280
18-29
24.0
63.0
1510
22.1
50.6
1120
30-49
22.3
68.5
1530
21.7
53.0
1150
50-69
21.5
65.0
1400
20.7
53.6
1110
70-
21.5
59.7
1280
20.7
49.0
1010
Then I’d like to describe about basis of computation depend on such age groups as adult, child, infant, pregnant and lactation.
Adult
EER in adult is obtained by multiplying BMR, it’s obtained by BMRV multiplied by RW, by physical activity level (PAL). I’d like to describe about PAL at last.
If BMI is less than 30, basal metabolic rate for Japanese is obtained by following equation, the function of age, gender, height and weight.
Child
EER in child is obtained by BMR multiplied by PAL and adding energy storage (ES). PAL in child is obtained by systematic review based on 24 studies in 2010 edition and 35 studies in 2015 edition, respectively.
Infant
EER in infant is obtained by adding total energy expenditure (TEE) to ES. TEE in infant is obtained by regression equation that has only weight as one independent variable according to FAO/WHO/UNU.
TEE in breastfed infant is obtained by following equation.
TEE in formula-fed infant is obtained by following equation.
Energy storage is the additional energy for increasing tissue in growing infant and child. Energy storage is as following table.
Energy Storage
Gender
Male
Female
Age (years)
RW (kg)
Weight Gain (kg/y)
Tissue Increase
RW (kg)
Weight Gain (kg/y)
Tissue Increase
Energy Density (kcal/g)
Energy Storage (kcal/d)
Energy Density (kcal/g)
Energy Storage (kcal/d)
0-5 M
6.4
9.5
4.4
120
5.9
8.7
5.0
120
6-8 M
8.5
3.4
1.5
15
7.8
3.4
1.8
15
9-11 M
9.1
2.4
2.7
15
8.5
2.5
2.3
15
1-2
11.7
2.1
3.5
20
11.0
2.1
2.4
15
3-5
16.2
2.1
1.5
10
16.2
2.2
2.0
10
6-7
22.0
2.5
2.1
15
22.0
2.5
2.8
20
8-9
27.5
3.4
2.5
25
27.2
3.1
3.2
25
10-11
35.5
4.5
3.0
35
34.5
4.1
2.6
30
12-14
48.0
4.2
1.5
20
46.0
3.1
3.0
25
15-17
58.4
2.0
1.9
10
50.6
0.8
4.7
10
Pregnant
EER in pregnant is obtained by following equation. It’s assumed that weight gain at 9 months is 11 kg. Additional energy in pregnant is 50 kcal/d in early gestation, 250 kcal/d in mid gestation and 450 kcal/d in late gestation, respectively.
Lactation
EER in lactation is obtained by following equation. Additional energy in lactation is 350 kcal/d. Energy content of human milk is 663 kcal/L.
Physical Activity Level
Physical activity level (PAL) is an index of physical activity obtained by daily energy consumption divided by BMR. PAL is directly observed by doubly-labeled water method. A hydrogen atom is usually a proton with one atomic weight and an oxgen atom is 16 atomic weight, respectively. Stable isotope of them are deuterium with 2 atomic weight and heavy oxygen with 17 or 18 atomic weight, respectively. Doubly labeled water method is that titrate the ratio of excretion to urine of the heavy oxygen and deuterium. It’s the most accurate method.
Physical activity level in 2015 edition is as following table. The population was divided into 3 groups according to 25 percentile and 75 percentile, sorted in ascending order, I, II and III. The representative value of each groups are 1.50, 1.75 2.00, respectively.
Physical Activity Level according to age group in 2015 edition (Unisex)
Physical Activity Level
I (Low)
II (Middle)
III (High)
1-2
1.35
3-5
1.45
6-7
1.35
1.55
1.75
8-9
1.40
1.60
1.80
10-11
1.45
1.65
1.85
12-14
1.50
1.70
1.90
15-17
1.55
1.75
1.95
18-29
1.50
1.75
2.00
30-49
1.50
1.75
2.00
50-69
1.50
1.75
2.00
70-
1.45
1.70
1.95
Physical activity level in 2010 edition is as following table.
Physical Activity Level according to age group in 2010 edition (Unisex)
A simple closed curve is a curve which does not intersect itself anywhere. Mathematically, a curve in the plane is defined by the parametric equations where and are single-valued and continuous in an interval . If and , the curve is said to be closed. If and only when (except in the special case where and ), the curve is closed and does not intersect itself and so is a simple closed curve. We shall also assume, unless otherwise stated, that and are piecewise differentiable in .
If a plane region has the property that any closed curve in it can be continuously shrunk to a point without leaving the region, then the region is called simply-connected, otherwise it is called multiply-connected.
As the parameter varies from to , the plane curve is described in a certain sense or direction. For curves in the plane, we arbitrarily describe this direction as positive or negative according as a person traversing the curve in this direction with his head pointing in the positive direction has the region enclosed by the curve always toward his left or right respectively. If we look down upon a simple closed curve in the plane, this amounts to saying that traversal of the curve in the counterclockwise direction is taken as positive while traversal in the clockwise direction is taken as negative.
Basal metabolic rate (BMR) is the minimal energy in awake. The basal metabolism reference value and the predictive equations of National Institute of Health and Nutrition are reliable in Japanese and the predictive equations of Schofield and FAO/WHO/UNU are internationally common, respectively.
Curiously, the result was too small when I assigned weight and height into predictive equation of FAO/WHO/UNU in the age group of 18-29 year-old female. Although I have obtained the original article and reviewed the contents, I could not find the predictive equations. They seem to calculate BMR from Schofield’s predictive equations.
Predictive equations for BMR (upper: male, lower: female)


dV = \underset{S}{\iint}(A_1\cos\alpha + A_2\cos\beta + A_3\cos\gamma)dS\cdots(35)")
![\displaystyle \underset{V}{\iiint}\left( \frac{\partial A_1}{\partial x} + \frac{\partial A_2}{\partial y} + \frac{\partial A_3}{\partial z} \right)dV = \underset{S}{\iint}[ A_1dydz + A_2dzdx + A_3dxdy ]\cdots (36)](https://s0.wp.com/latex.php?latex=%5Cdisplaystyle+%5Cunderset%7BV%7D%7B%5Ciiint%7D%5Cleft%28+%5Cfrac%7B%5Cpartial+A_1%7D%7B%5Cpartial+x%7D+%2B+%5Cfrac%7B%5Cpartial+A_2%7D%7B%5Cpartial+y%7D+%2B+%5Cfrac%7B%5Cpartial+A_3%7D%7B%5Cpartial+z%7D+%5Cright%29dV+%3D+%5Cunderset%7BS%7D%7B%5Ciint%7D%5B+A_1dydz+%2B+A_2dzdx+%2B+A_3dxdy+%5D%5Ccdots+%2836%29&bg=T&fg=000000&s=0 "\displaystyle \underset{V}{\iiint}\left( \frac{\partial A_1}{\partial x} + \frac{\partial A_2}{\partial y} + \frac{\partial A_3}{\partial z} \right)dV = \underset{S}{\iint}[ A_1dydz + A_2dzdx + A_3dxdy ]\cdots (36)")


")

on the
plane as in the adjoining Fig. 6-3. Assume that an equation for
, where
is single-valued and continuous for all
subregions of area
, and erect a vertical column on each of these subregions to intersect
.
be single-valued and continuous at all points of
is some point of
in such a way that each
exists, the resulting limit is called the surface integral of
over
approximately, where
is the angle between the normal line to
is given by
has continuous (or sectionally continuous) derivatives in
, (33) can also be written
which are of this type. Then the surface integral over
or
planes. For such cases (30) can be evaluated by appropriately modifying (33) and (34).

to be independent of the path
joining any two given points in a region
is an exact differential, i.e. that there exists a function
such that
. In such case if the end points of curve
and
, the value of the line integral is given by
and
to be independent of the path
and condition (26) is equivalent to the condition
. If
which acts on an object, the result is equivalent to the statement that the work done in moving the object from one point to another is independent of the path joining the two points if and only if
] is also the condition that
[or
] is an exact differential, i.e. that there exists a function
. In such case if the endpoints of curve
and
, the value of the line integral is given by
, we have
")

be single-valued and continuous in a simply-connected region
is used to emphasize that


} = \mathrm{BMRV\ (kcal/kg/d)} \times \mathrm{RW\ (kg)} \times \mathrm{PAL} \\ \\ \mathrm{EER: estimated\ energy\ requirement}\\ \mathrm{BMRV: basal\ metabolism\ reference\ value} \\ \mathrm{RW: reference\ weight}\\ \mathrm{PAL: physical\ activity\ level}")
}\\ = 0.0481 \times \mathrm{W\ (kg)} + 0.0234 \times \mathrm{H\ (cm)} - 0.0138 \times \mathrm{A\ (years)} - \mathrm{C} \\ \\ \mathrm{BMR:\ basal\ metabolic\ rate}\\ \mathrm{W : weight}\\ \mathrm{H : height}\\ \mathrm{A : age}\\ \mathrm{C : 0.4235\ (male), 0.9708\ (female)}")
where
and
are single-valued and continuous in an interval
. If
and
, the curve is said to be closed. If
and
only when
(except in the special case where
and
), the curve is closed and does not intersect itself and so is a simple closed curve. We shall also assume, unless otherwise stated, that
and
are piecewise differentiable in
varies from
to
, the plane curve is described in a certain sense or direction. For curves in the
 \times 1000/4.186")
 \times 1000/4.186")


 \times 1000/4.186")
 \times 1000/4.186")
 \times 1000/4.186")
 \times 1000/4.186")
 \times 1000/4.186")
 \times 1000/4.186")
 \times 1000/4.186")
 \times 1000/4.186")
 \times 1000/4.186")
 \times 1000/4.186")
 \times 1000/4.186")
 \times 1000/4.186")
/4.186")
/4.186")
/4.186")
/4.186")
/4.186")
/4.186")
is another point on C.
\Delta S_p \cdots(29)")
dS\cdots(30)")
|\sec\gamma|dA\cdots(31)")
^2 + \left( \frac{\partial z}{\partial y} \right)^2}\cdots(32)")
\sqrt{1 + \left( \frac{\partial z}{\partial x} \right)^2 + \left( \frac{\partial z}{\partial y} \right)^2}dxdy \cdots(33)")
\frac{\sqrt{(F_x)^2 + (F_y)^2 + (F_z)^2}}{|F_z|}dxdy\cdots(34)")
")
![\displaystyle \int_{(x_1, y_1)}^{(x_2, y_2)}[Pdx + Qdy] = \int_{(x_1, y_1)}^{(x_2, y_2)} d\phi = \phi(x_2, y_2) - \phi(x_1, y_1) \cdots(24)](https://s0.wp.com/latex.php?latex=%5Cdisplaystyle+%5Cint_%7B%28x_1%2C+y_1%29%7D%5E%7B%28x_2%2C+y_2%29%7D%5BPdx+%2B+Qdy%5D+%3D+%5Cint_%7B%28x_1%2C+y_1%29%7D%5E%7B%28x_2%2C+y_2%29%7D+d%5Cphi+%3D+%5Cphi%28x_2%2C+y_2%29+-+%5Cphi%28x_1%2C+y_1%29+%5Ccdots%2824%29&bg=T&fg=000000&s=0 "\displaystyle \int_{(x_1, y_1)}^{(x_2, y_2)}[Pdx + Qdy] = \int_{(x_1, y_1)}^{(x_2, y_2)} d\phi = \phi(x_2, y_2) - \phi(x_1, y_1) \cdots(24)")
![\displaystyle \oint_C [Pdx + Qdy] = 0\cdots(25)](https://s0.wp.com/latex.php?latex=%5Cdisplaystyle+%5Coint_C+%5BPdx+%2B+Qdy%5D+%3D+0%5Ccdots%2825%29&bg=T&fg=000000&s=0 "\displaystyle \oint_C [Pdx + Qdy] = 0\cdots(25)")
")
}^{(x_2, y_2, z_2)}\bold{A}\cdot\bold{r} = \int_{(x_1, y_1, z_1)}^{(x_2, y_2, z_2)}d\phi = \phi(x_2, y_2, z_2)- \phi(x_1, y_1, z_1)\cdots(27)")


 \times A\\ \\ I = H \times 1.25")
![\displaystyle \oint_C [Pdx + Qdy] = \underset{\cal R}{\iint}\left( \frac{\partial Q}{\partial x} - \frac{\partial P}{\partial y} \right)dxdy\cdots(22)](https://s0.wp.com/latex.php?latex=%5Cdisplaystyle+%5Coint_C+%5BPdx+%2B+Qdy%5D+%3D+%5Cunderset%7B%5Ccal+R%7D%7B%5Ciint%7D%5Cleft%28+%5Cfrac%7B%5Cpartial+Q%7D%7B%5Cpartial+x%7D+-+%5Cfrac%7B%5Cpartial+P%7D%7B%5Cpartial+y%7D+%5Cright%29dxdy%5Ccdots%2822%29&bg=T&fg=000000&s=0 "\displaystyle \oint_C [Pdx + Qdy] = \underset{\cal R}{\iint}\left( \frac{\partial Q}{\partial x} - \frac{\partial P}{\partial y} \right)dxdy\cdots(22)")
} = \mathrm{BMR\ (kcal/d)} \times \mathrm{PAL} + \mathrm{ES\ (kcal/d)}\\ \\ \mathrm{BMR: basal\ metabolic\ rate}\\ \mathrm{ES: energy\ storage}\\")
} = \mathrm{TEE\ (kcal/d)} + \mathrm{ES\ (kcal/d)}\\ \\ \mathrm{TEE: total\ energy\ expenditure}")
} = 92.8 \times \mathrm{RW\ (kg) }- 152.0")
} = 82.6 \times \mathrm{RW\ (kg)} - 29.0")
} \\ = \mathrm{EER\ before\ pregnancy\ (kcal/d)} + \mathrm{AE\ (kcal/d)}\\ \\ \mathrm{AE\ :\ additional\ energy}")
} \\ = \mathrm{EER\ before\ pregnancy\ (kcal/d)} + \mathrm{AE\ (kcal/d)}")
},\ H\mathrm{:\ height\ (cm)},\ A\mathrm{:\ age\ (years)}")
![\displaystyle \int_C [P(x, y)dx + Q(x, y)dy] = \int_C P(x, y)dx + \int_C Q(x, y)dy](https://s0.wp.com/latex.php?latex=%5Cdisplaystyle+%5Cint_C+%5BP%28x%2C+y%29dx+%2B+Q%28x%2C+y%29dy%5D+%3D+%5Cint_C+P%28x%2C+y%29dx+%2B+%5Cint_C+Q%28x%2C+y%29dy&bg=T&fg=000000&s=0 "\displaystyle \int_C [P(x, y)dx + Q(x, y)dy] = \int_C P(x, y)dx + \int_C Q(x, y)dy")
![\displaystyle \int_{(a_1, b_1)}^{(a_2, b_2)} [Pdx + Qdy] = - \int_{(a_2, b_2)}^{(a_1, b_1)}[Pdx + Qdy]](https://s0.wp.com/latex.php?latex=%5Cdisplaystyle+%5Cint_%7B%28a_1%2C+b_1%29%7D%5E%7B%28a_2%2C+b_2%29%7D+%5BPdx+%2B+Qdy%5D+%3D+-+%5Cint_%7B%28a_2%2C+b_2%29%7D%5E%7B%28a_1%2C+b_1%29%7D%5BPdx+%2B+Qdy%5D&bg=T&fg=000000&s=0 "\displaystyle \int_{(a_1, b_1)}^{(a_2, b_2)} [Pdx + Qdy] = - \int_{(a_2, b_2)}^{(a_1, b_1)}[Pdx + Qdy]")
![\displaystyle \int_{(a_1, b_1)}^{(a_2, b_2)} [Pdx + Qdy] = \int_{(a_1, b_1)}^{(a_3, b_3)} [Pdx + Qdy] + \int_{(a_3, b_3)}^{(a_2, b_2)} [Pdx + Qdy]](https://s0.wp.com/latex.php?latex=%5Cdisplaystyle+%5Cint_%7B%28a_1%2C+b_1%29%7D%5E%7B%28a_2%2C+b_2%29%7D+%5BPdx+%2B+Qdy%5D+%3D+%5Cint_%7B%28a_1%2C+b_1%29%7D%5E%7B%28a_3%2C+b_3%29%7D+%5BPdx+%2B+Qdy%5D+%2B+%5Cint_%7B%28a_3%2C+b_3%29%7D%5E%7B%28a_2%2C+b_2%29%7D+%5BPdx+%2B+Qdy%5D+&bg=T&fg=000000&s=0 "\displaystyle \int_{(a_1, b_1)}^{(a_2, b_2)} [Pdx + Qdy] = \int_{(a_1, b_1)}^{(a_3, b_3)} [Pdx + Qdy] + \int_{(a_3, b_3)}^{(a_2, b_2)} [Pdx + Qdy]")